Fig. 4.
Download original image
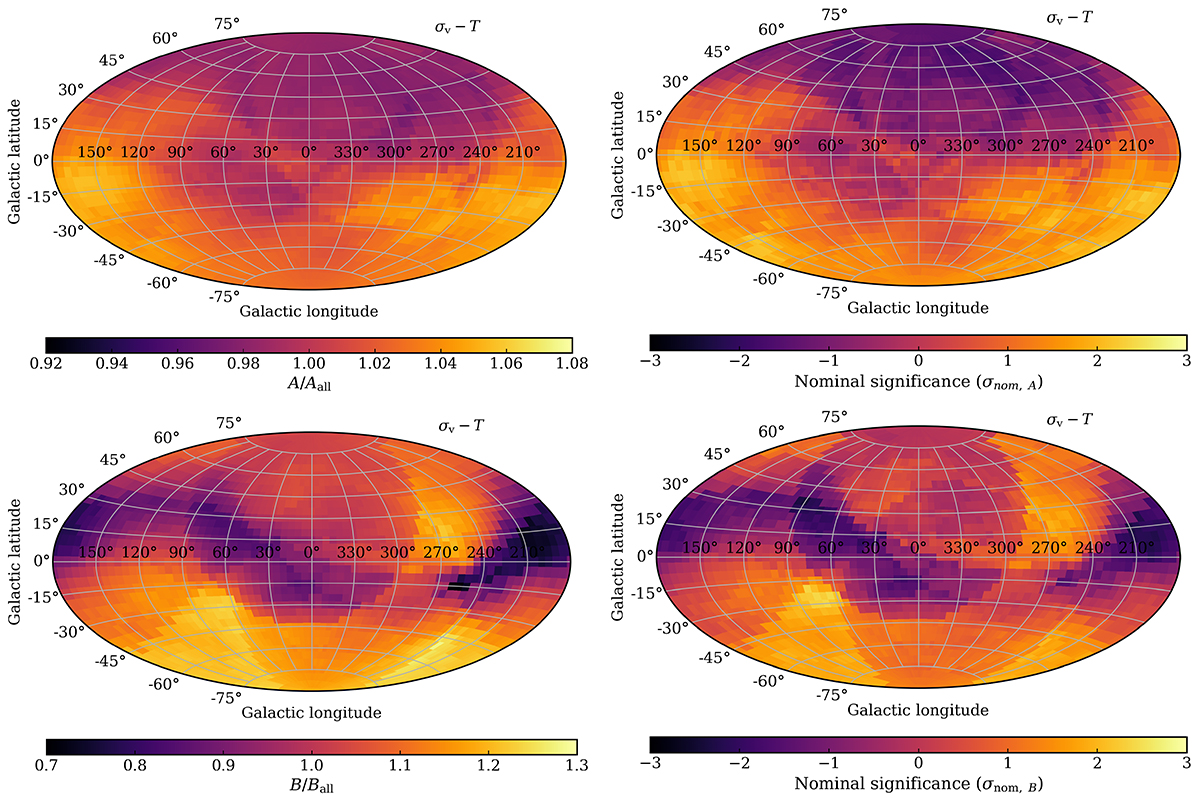
Left panel: maps of best-fit normalisation (top) and the slope (bottom) compared to the full sample for the σv − T relation. Note that the colour scale is different for both maps. This highlights the small variations in the A/Aall map. Right panel: nominal significance maps for the normalisation (top) and slope (bottom). Both maps have the same colour scale (−3σnom to +3σnom). A negative sigma value refers to a value lower than the rest of the sky.
Current usage metrics show cumulative count of Article Views (full-text article views including HTML views, PDF and ePub downloads, according to the available data) and Abstracts Views on Vision4Press platform.
Data correspond to usage on the plateform after 2015. The current usage metrics is available 48-96 hours after online publication and is updated daily on week days.
Initial download of the metrics may take a while.