Open Access
Fig. A.1.
Download original image
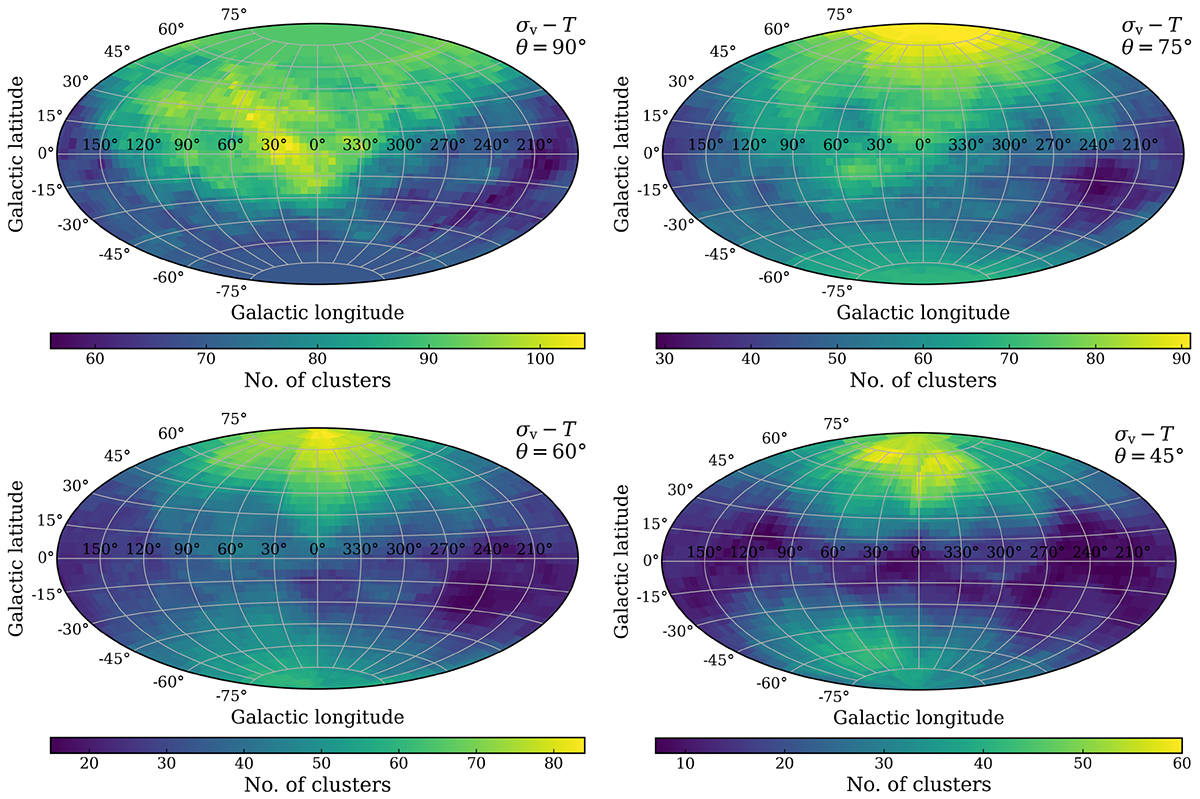
Maps of the number of clusters for different cone sizes in the relation σv − T. The cone sizes are 90° (top left), 75° (top right), 60° (bottom left), and 45° (bottom right). Note that the colour scale is different for the four plots.
Current usage metrics show cumulative count of Article Views (full-text article views including HTML views, PDF and ePub downloads, according to the available data) and Abstracts Views on Vision4Press platform.
Data correspond to usage on the plateform after 2015. The current usage metrics is available 48-96 hours after online publication and is updated daily on week days.
Initial download of the metrics may take a while.