Open Access
Fig. 19.
Download original image
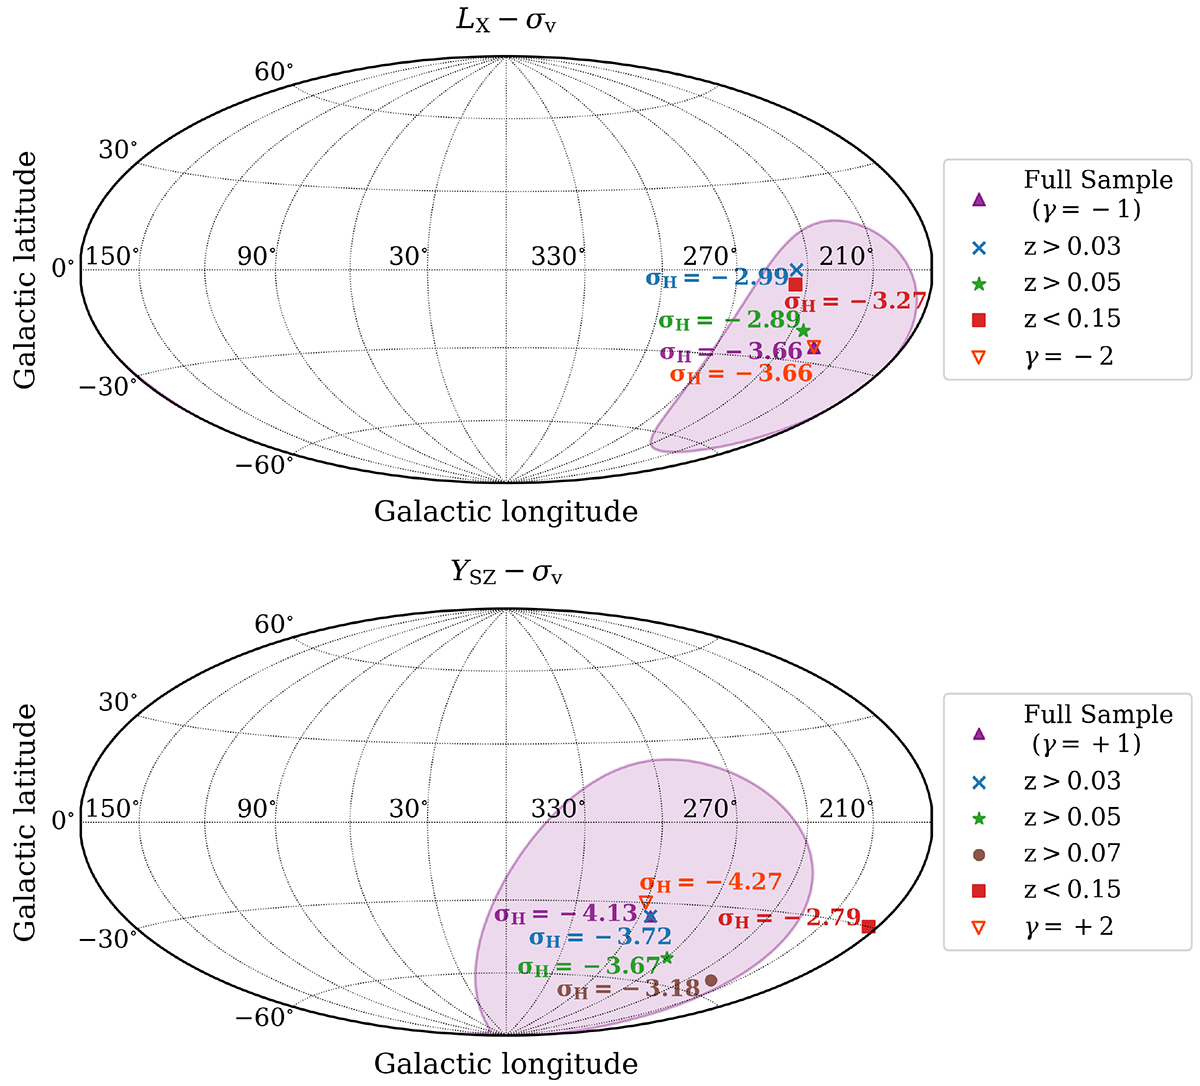
Positions and amplitude of maximum anisotropy detected for several z cuts and z evolution power for LX − σv (top), and YSZ − σv (bottom) relations. The shaded regions represent the directional uncertainties of the full sample.
Current usage metrics show cumulative count of Article Views (full-text article views including HTML views, PDF and ePub downloads, according to the available data) and Abstracts Views on Vision4Press platform.
Data correspond to usage on the plateform after 2015. The current usage metrics is available 48-96 hours after online publication and is updated daily on week days.
Initial download of the metrics may take a while.