Fig. 4
Download original image
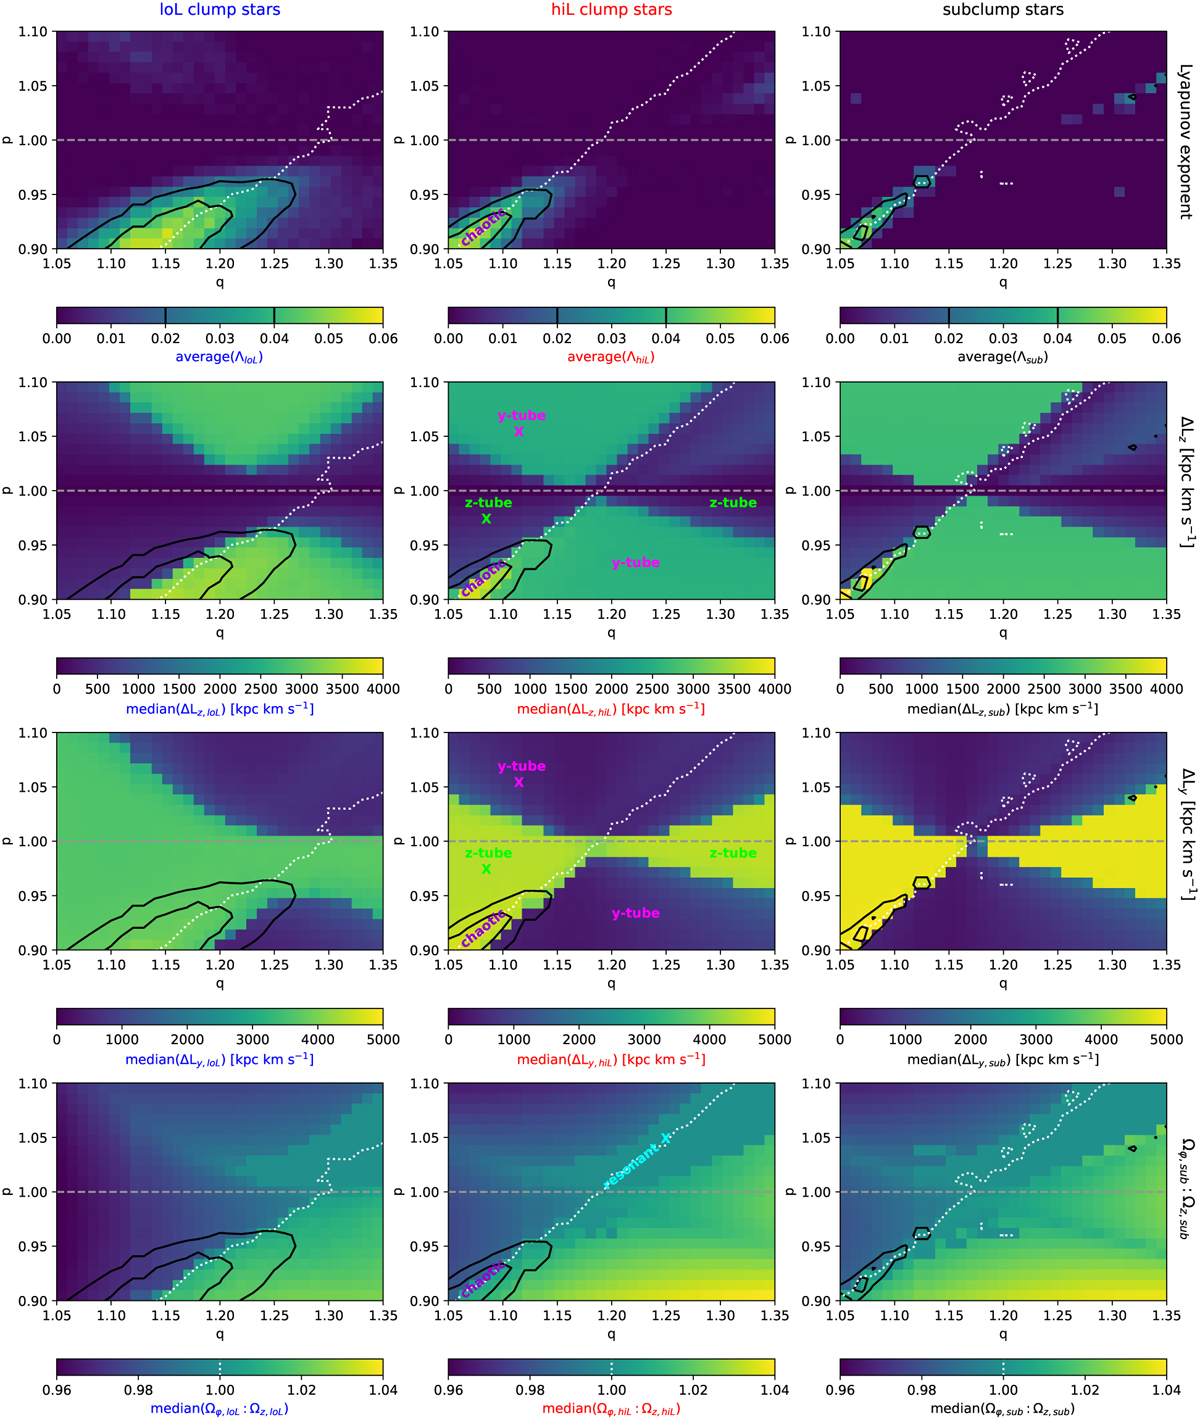
Various dynamical quantities of the loL stars (left column) and hiL stars (middle column) and subclump stars (right column) in a potential with a triaxial halo with a range of p and q as calculated by AGAMA for an integration time of 100 Gyr. The grey horizontal line at p = 1 serves to guide the eye and indicates axisymmetric potentials. The white dotted line indicates the Ωϕ : Ωz = 1:1 resonance (see also bottom row). Top row: average Lyapunov exponent. A non-zero Lyapunov exponent indicates that there is chaoticity. The overlaid black contours, which are also shown in the other rows, map average(Λ*) at the levels of 0.02 and 0.04, as is also indicated on the colourbar. Second row: median variation in Lz, with ΔLz,* = max(Lz,*) − min(Lz,*) over the entire integration time. Third row: median variation in Ly, with ΔLy,* = max(Ly,*) − min(Ly,*) over the entire integration time. Bottom row: median(Ωϕ : Ωz) ratio. We can see clear correspondences between the four different rows. The chaotic regions overlap with the median(Ωϕ : Ωz) = 1:1 resonance and a transition in the value of ΔLz and ΔLy. This transition indicates a change in orbit family, and the text in the middle column indicates where the different orbit families reside, of which examples are shown in Fig. 5 (the crosses in this figure indicate their p and q). To the left of the chaotic band we find z-tube orbits, which have an oscillating Ly and a roughly conserved Lz, such that median(ΔLy) ≲ 4000 kpc km s−1, median(ΔLz) ≲ 500 kpc km s−1. To the right of the chaotic band we find y-tube orbits, which have a roughly conserved Ly and an oscillating Lz, such that median(ΔLy) ~ 1000 kpc km s−1 and median(Δ Lz) ~ 3000 kpc km s−1. For p > 1, the Ωϕ:Ωz = 1:1 is a resonance that traps orbits, which reduces their variation in both Ly and Lz. This is most clear for the subclump stars.
Current usage metrics show cumulative count of Article Views (full-text article views including HTML views, PDF and ePub downloads, according to the available data) and Abstracts Views on Vision4Press platform.
Data correspond to usage on the plateform after 2015. The current usage metrics is available 48-96 hours after online publication and is updated daily on week days.
Initial download of the metrics may take a while.