Fig. 9.
Download original image
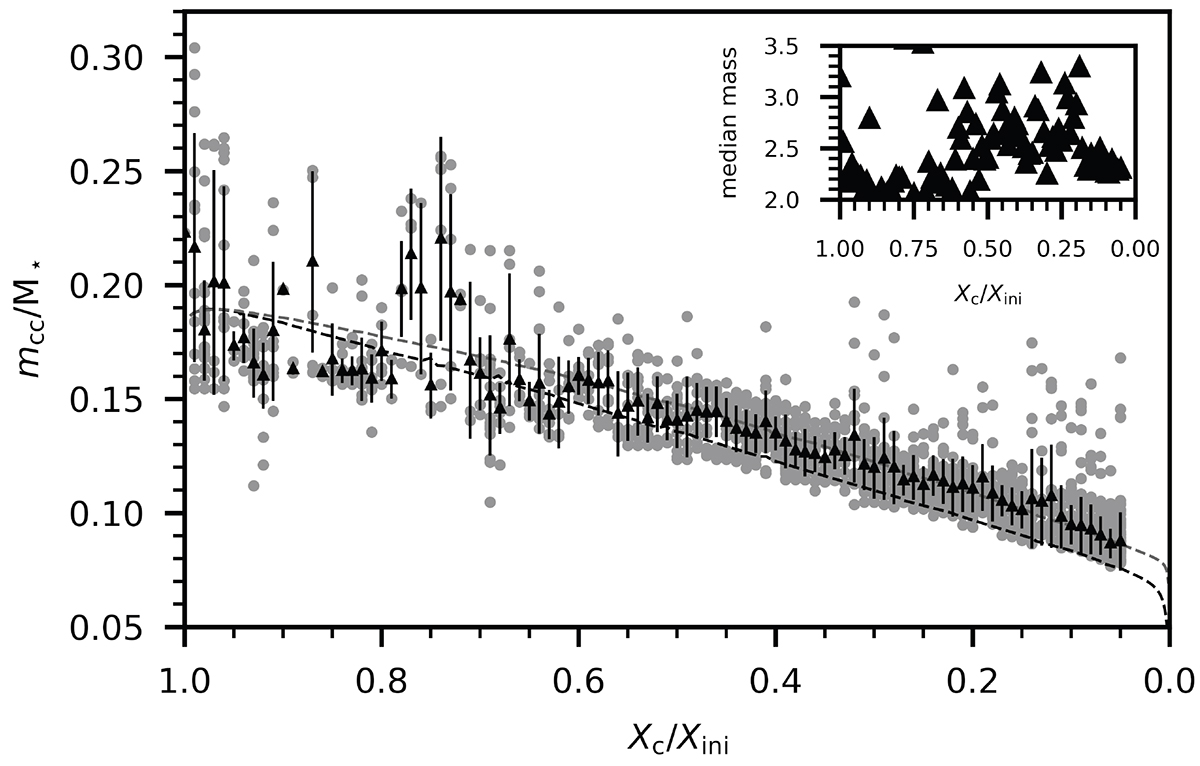
Relation between the inferred fraction Xc/Xini and the convective core mass for stars M⋆ > 2 M⊙. The black triangles indicate the average per bin and standard deviation. Two models are shown for 2.4 M⊙ and ω0 = 0.05, where the mass is representative of the median stellar mass per bin as shown in the inset. The black colour corresponds to fCBM = 0.005, the red colour to fCBM = 0.025.
Current usage metrics show cumulative count of Article Views (full-text article views including HTML views, PDF and ePub downloads, according to the available data) and Abstracts Views on Vision4Press platform.
Data correspond to usage on the plateform after 2015. The current usage metrics is available 48-96 hours after online publication and is updated daily on week days.
Initial download of the metrics may take a while.