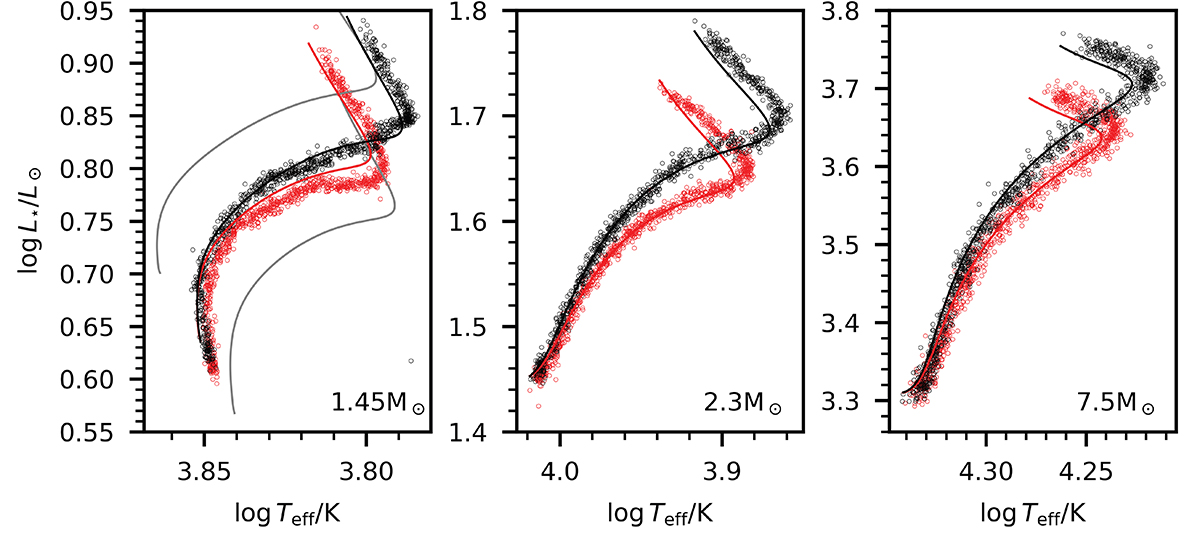
Fig. B.1.
Download original image
HRD showing stellar evolution tracks unseen by the CNF, and the sampling of these tracks by the CNF. The red colour indicates fCBM = 0.01, the black colour indicates fCBM = 0.02. In the left panel, tracks for 1.4 and 1.5 M⊙ (fCBM = 0.015, ω0 = 0.05) are shown in grey to illustrate the distance between two evolution tracks in the grid and the interpolation error of the CNF.
Current usage metrics show cumulative count of Article Views (full-text article views including HTML views, PDF and ePub downloads, according to the available data) and Abstracts Views on Vision4Press platform.
Data correspond to usage on the plateform after 2015. The current usage metrics is available 48-96 hours after online publication and is updated daily on week days.
Initial download of the metrics may take a while.