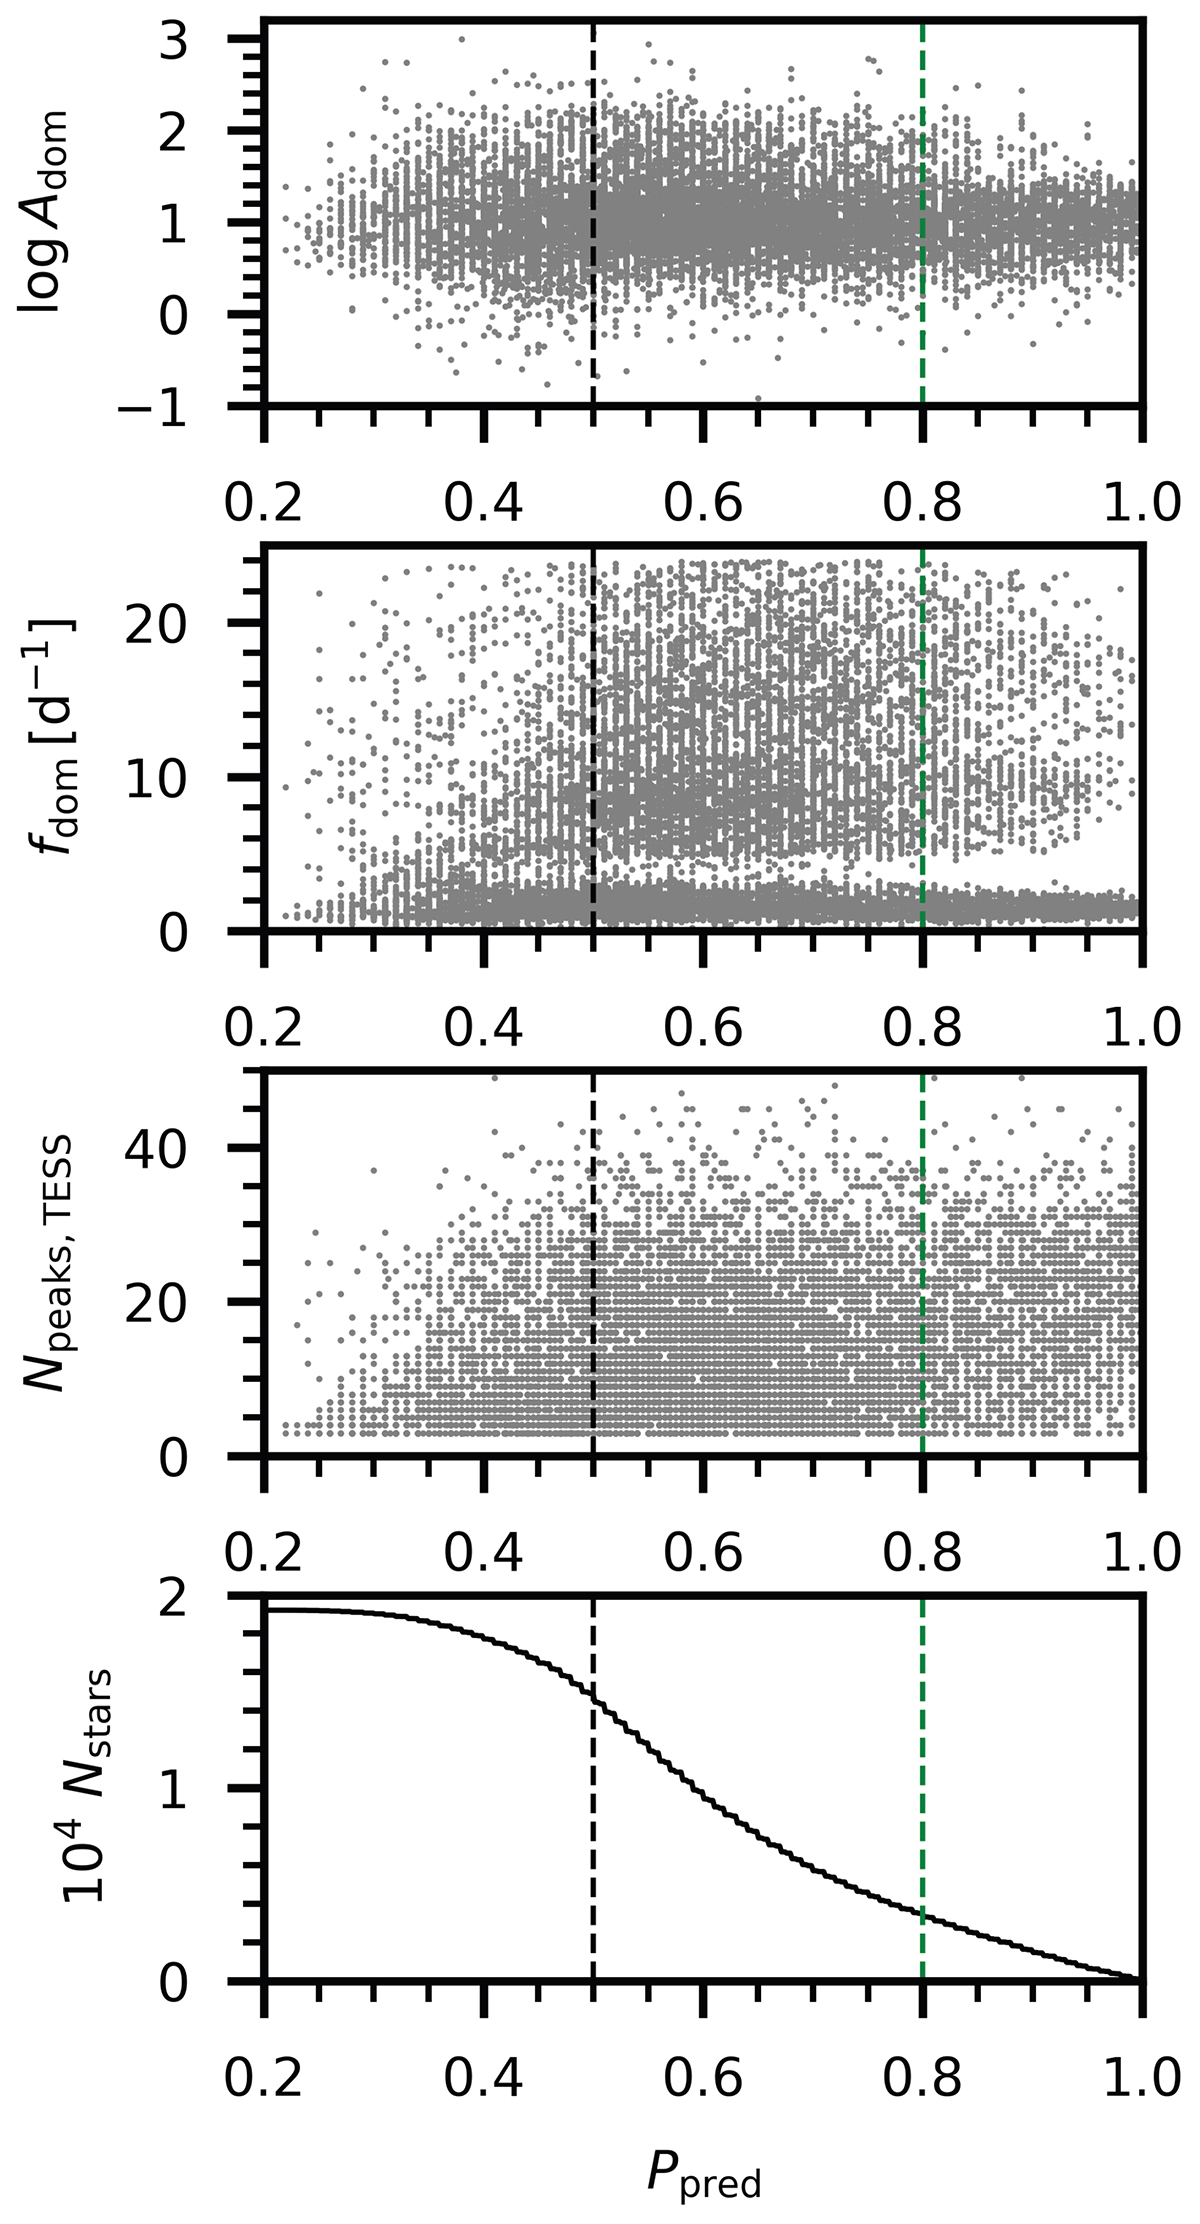
Fig. 1.
Download original image
Pulsational characteristics of the sample. From top to bottom: amplitude of dominant frequency in the TESS light curve (in mmag), dominant frequency, and number of significant frequencies in the nominal TESS data. The bottom panel shows the number of stars above a given threshold on the classification probability Ppred from Hey & Aerts (2024). Vertical dashed lines indicate the used threshold in Ppred for the different samples.
Current usage metrics show cumulative count of Article Views (full-text article views including HTML views, PDF and ePub downloads, according to the available data) and Abstracts Views on Vision4Press platform.
Data correspond to usage on the plateform after 2015. The current usage metrics is available 48-96 hours after online publication and is updated daily on week days.
Initial download of the metrics may take a while.