Fig. 5.
Download original image
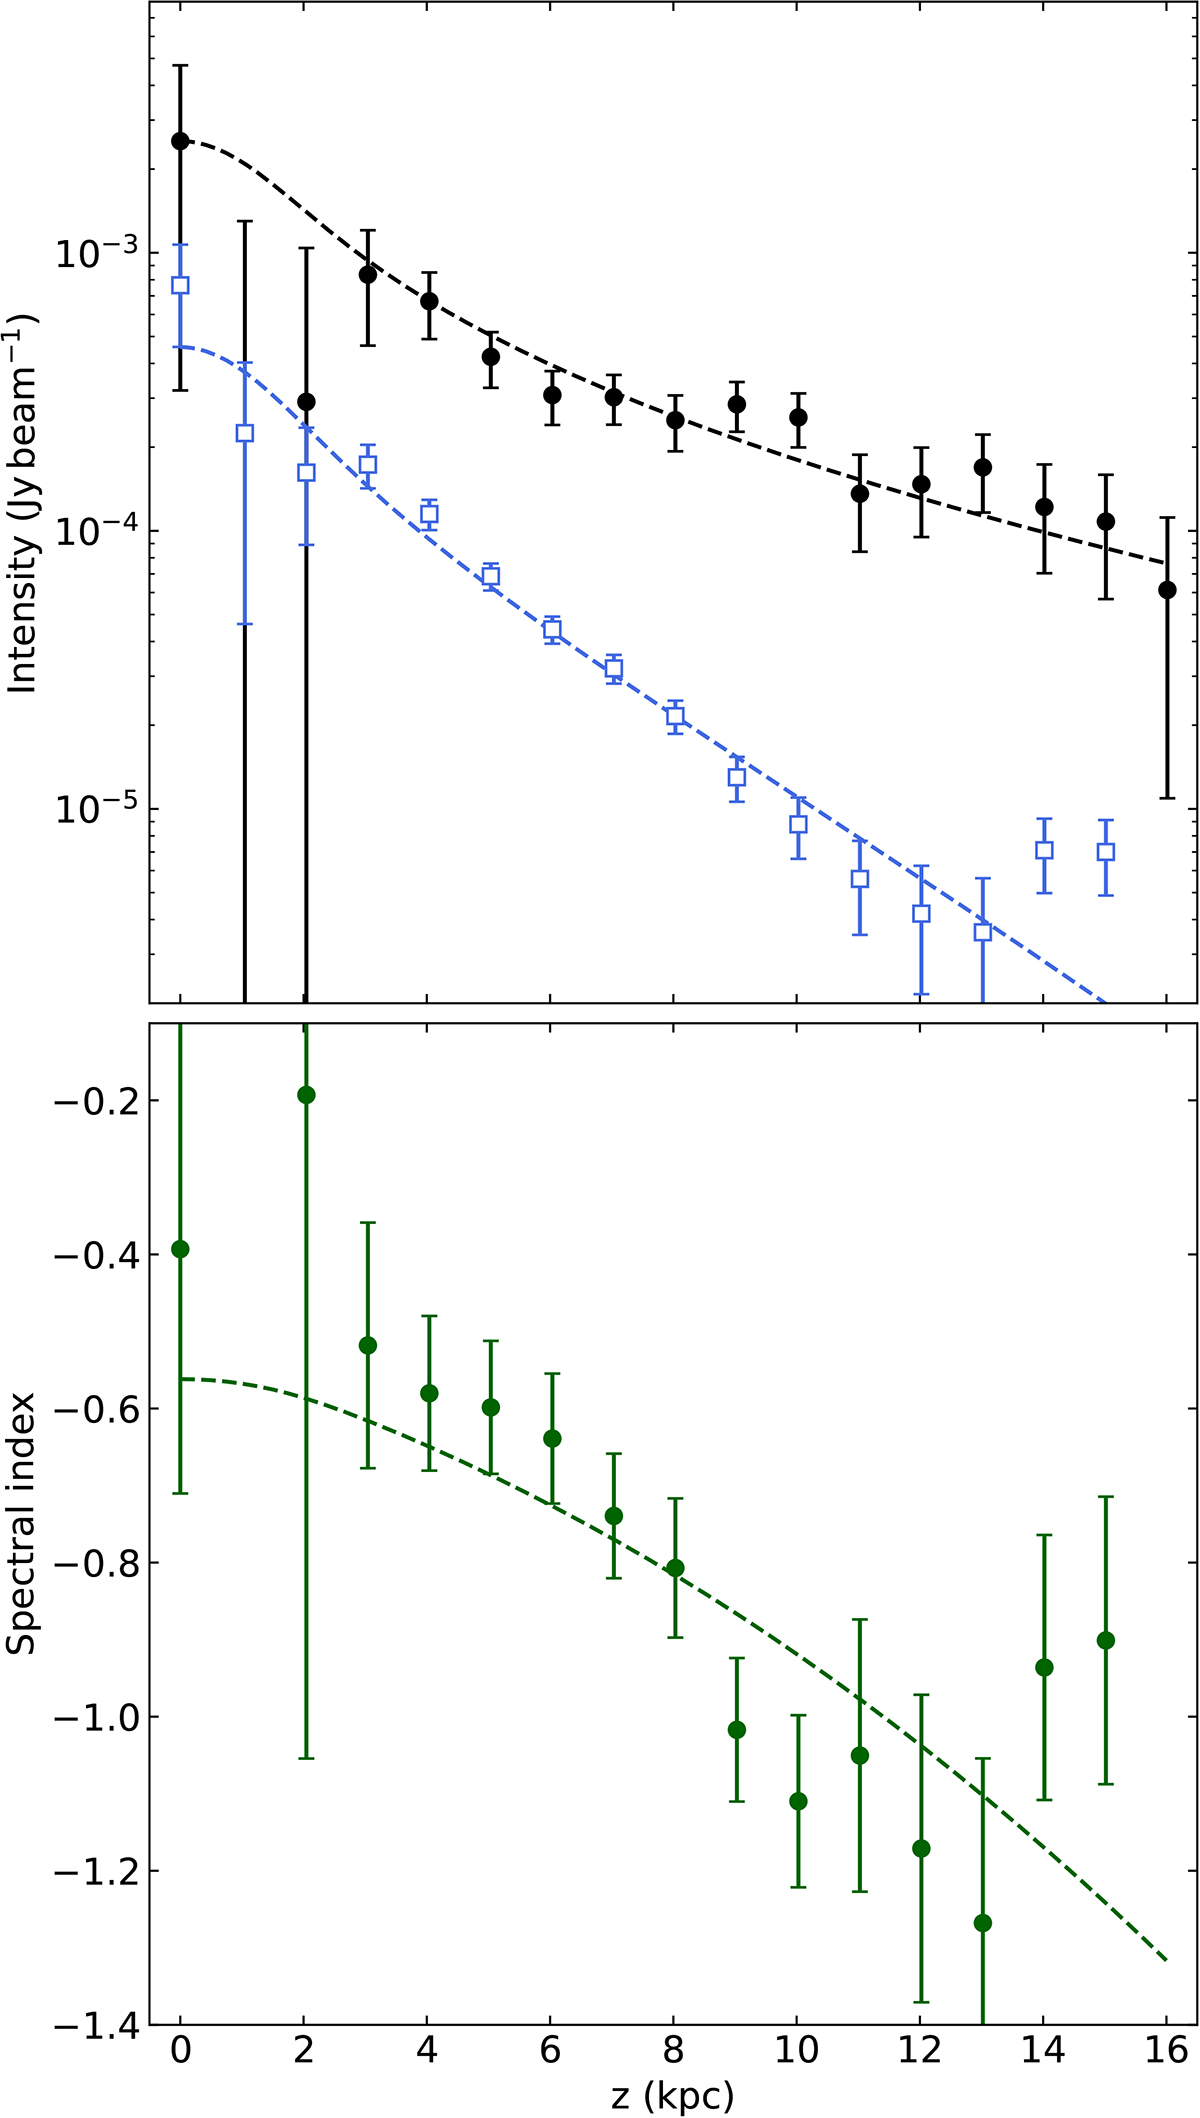
Radio continuum emission and radio spectral index in the superbubble. The thick disc component has been subtracted. We present the LOFAR 144 MHz (top graph, black) and S-band 3 GHz (top graph, blue) intensity profiles as well as the corresponding radio spectral index profile (bottom graph). Best-fitting SPINNAKER wind models are shown as dashed lines.
Current usage metrics show cumulative count of Article Views (full-text article views including HTML views, PDF and ePub downloads, according to the available data) and Abstracts Views on Vision4Press platform.
Data correspond to usage on the plateform after 2015. The current usage metrics is available 48-96 hours after online publication and is updated daily on week days.
Initial download of the metrics may take a while.