Open Access
Fig. 2.
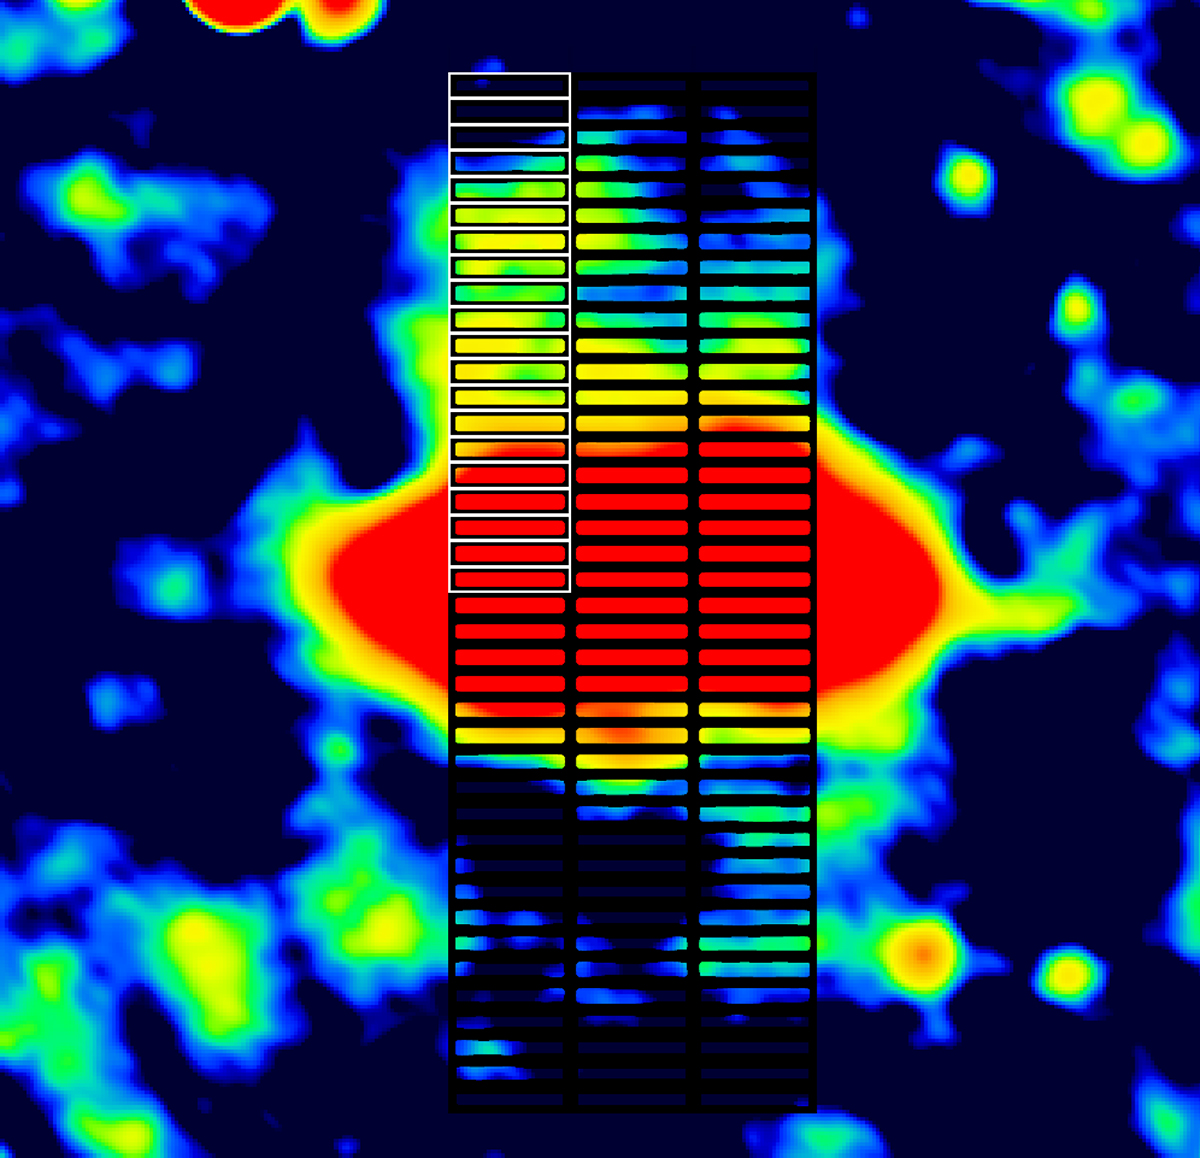
Download original image
Position of the vertical intensity profile of the superbubble in NGC 4217 overlaid on the LOFAR map with boosted extended emission. We use the top-left strip for the analysis (highlighted in white). We are probing the potential shell on the north-eastern side of the superbubble (cf. Fig. 1, right panel).
Current usage metrics show cumulative count of Article Views (full-text article views including HTML views, PDF and ePub downloads, according to the available data) and Abstracts Views on Vision4Press platform.
Data correspond to usage on the plateform after 2015. The current usage metrics is available 48-96 hours after online publication and is updated daily on week days.
Initial download of the metrics may take a while.