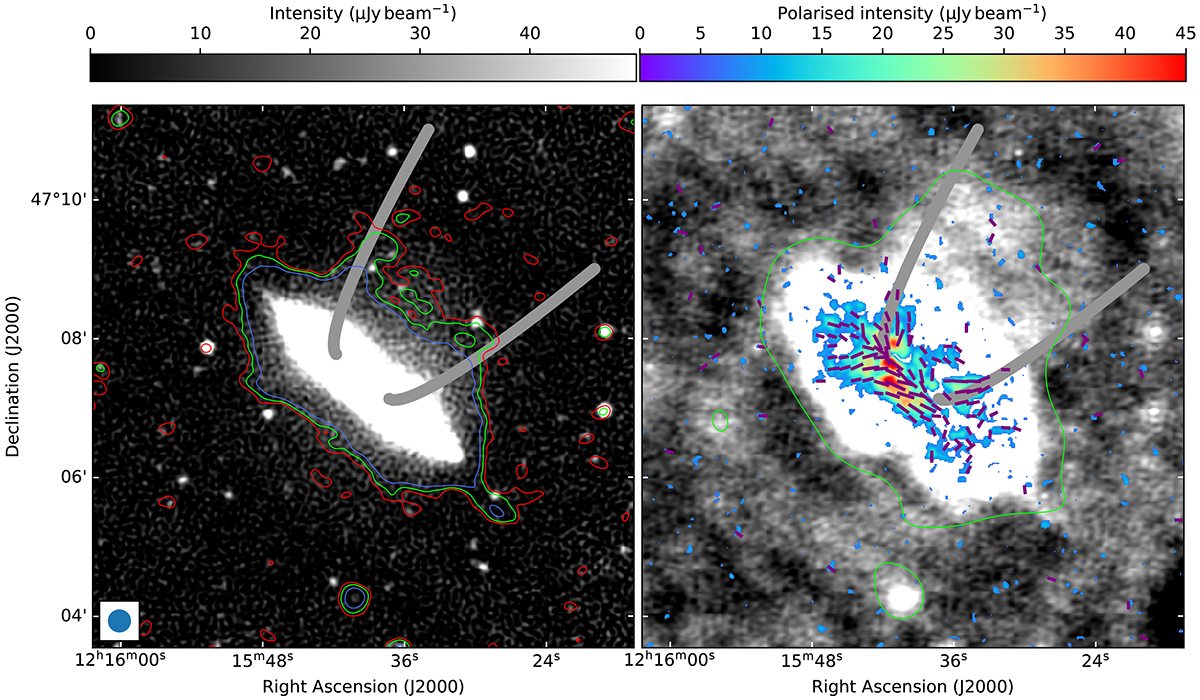
Fig. 1.
Download original image
Radio continuum emission in the halo of NGC 4217. Left: JVLA 3 GHz radio continuum emission at 7″ angular resolution, shown as the grey-scale background map. Contour lines show the 2, 3, and 5σ levels at 144 MHz (red, green, and blue) observed with LOFAR at 20″ angular resolution (indicated by the filled circle in the bottom-left corner). Confusing background sources have been subtracted from the 20″ map. Right: LOFAR radio continuum emission at 144 MHz imaged with enhanced diffuse extended emission at 20″ angular resolution (for details see Sect. 2.2). The contour line is at 320 μJy beam−1 with a resolution of 40″, equating to 0.8σ. Confusing background sources have been subtracted. The coloured emission displays polarised intensity at ≈9″ resolution at 3 GHz observed with JVLA, and the corresponding vectors show the orientation of the magnetic field (the vector length is proportional to the polarised intensity). Thick grey lines show the assumed shape of the CRE transport in the superbubble (Sect. 3.4).
Current usage metrics show cumulative count of Article Views (full-text article views including HTML views, PDF and ePub downloads, according to the available data) and Abstracts Views on Vision4Press platform.
Data correspond to usage on the plateform after 2015. The current usage metrics is available 48-96 hours after online publication and is updated daily on week days.
Initial download of the metrics may take a while.