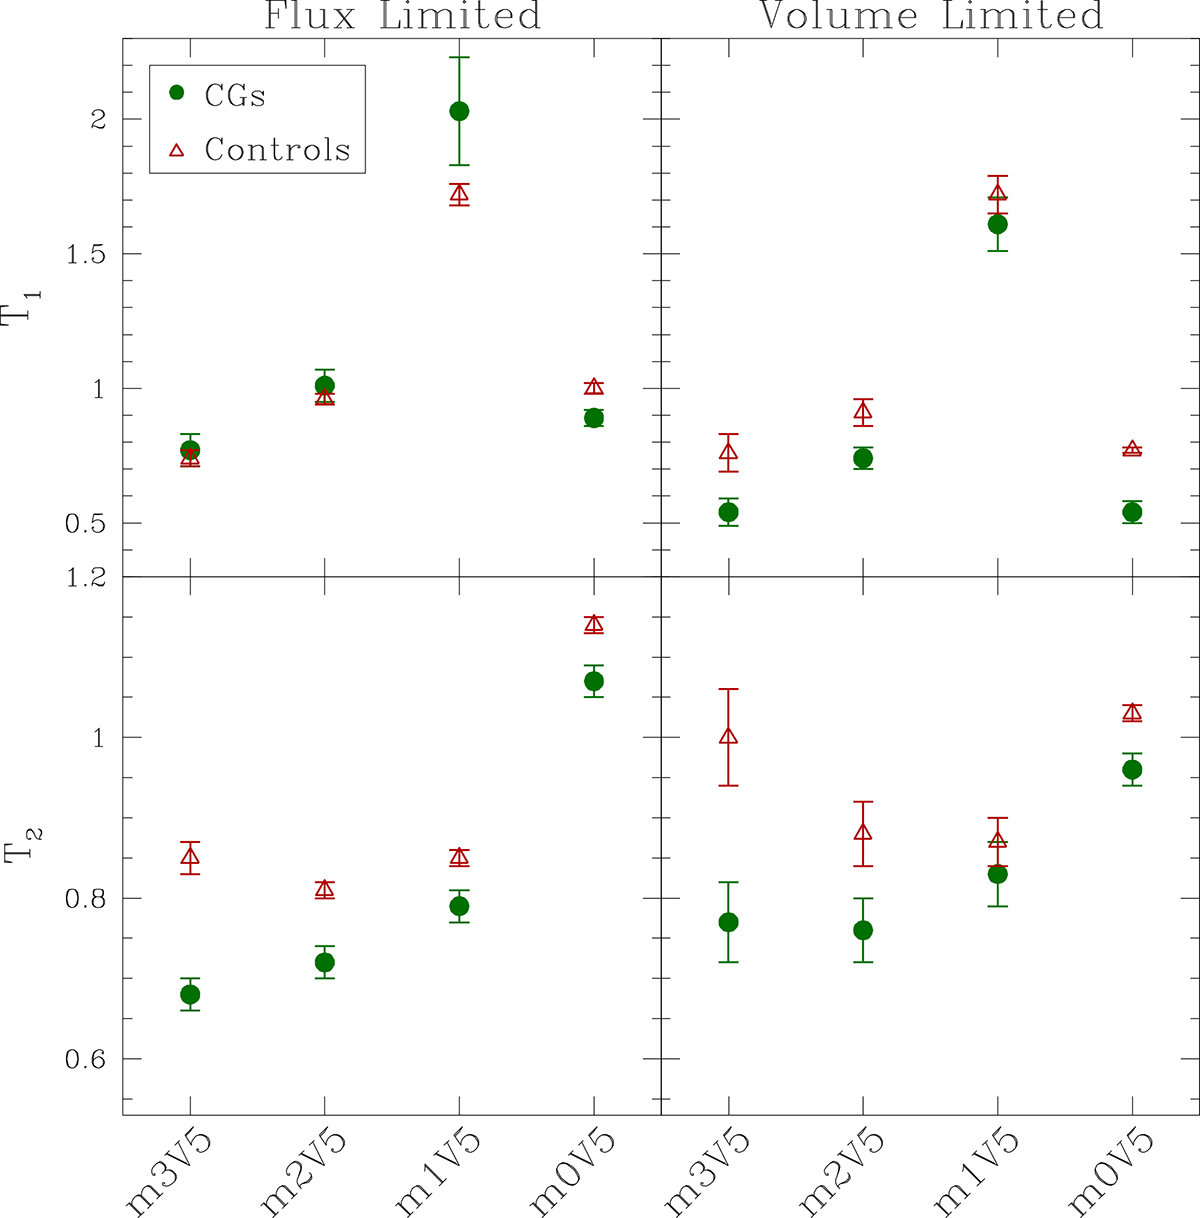
Fig. 9.
Download original image
Tremaine-Richstone statistics T1 and T2 (Tremaine & Richstone 1977) computed for the different samples of CGs (green circles) and controls (red triangles). The error bars are computed using the bootstrap technique. The left column displays the statistics computed for the flux-limited group samples, and the right column displays the results for the volume-limited sample of groups.
Current usage metrics show cumulative count of Article Views (full-text article views including HTML views, PDF and ePub downloads, according to the available data) and Abstracts Views on Vision4Press platform.
Data correspond to usage on the plateform after 2015. The current usage metrics is available 48-96 hours after online publication and is updated daily on week days.
Initial download of the metrics may take a while.