Open Access
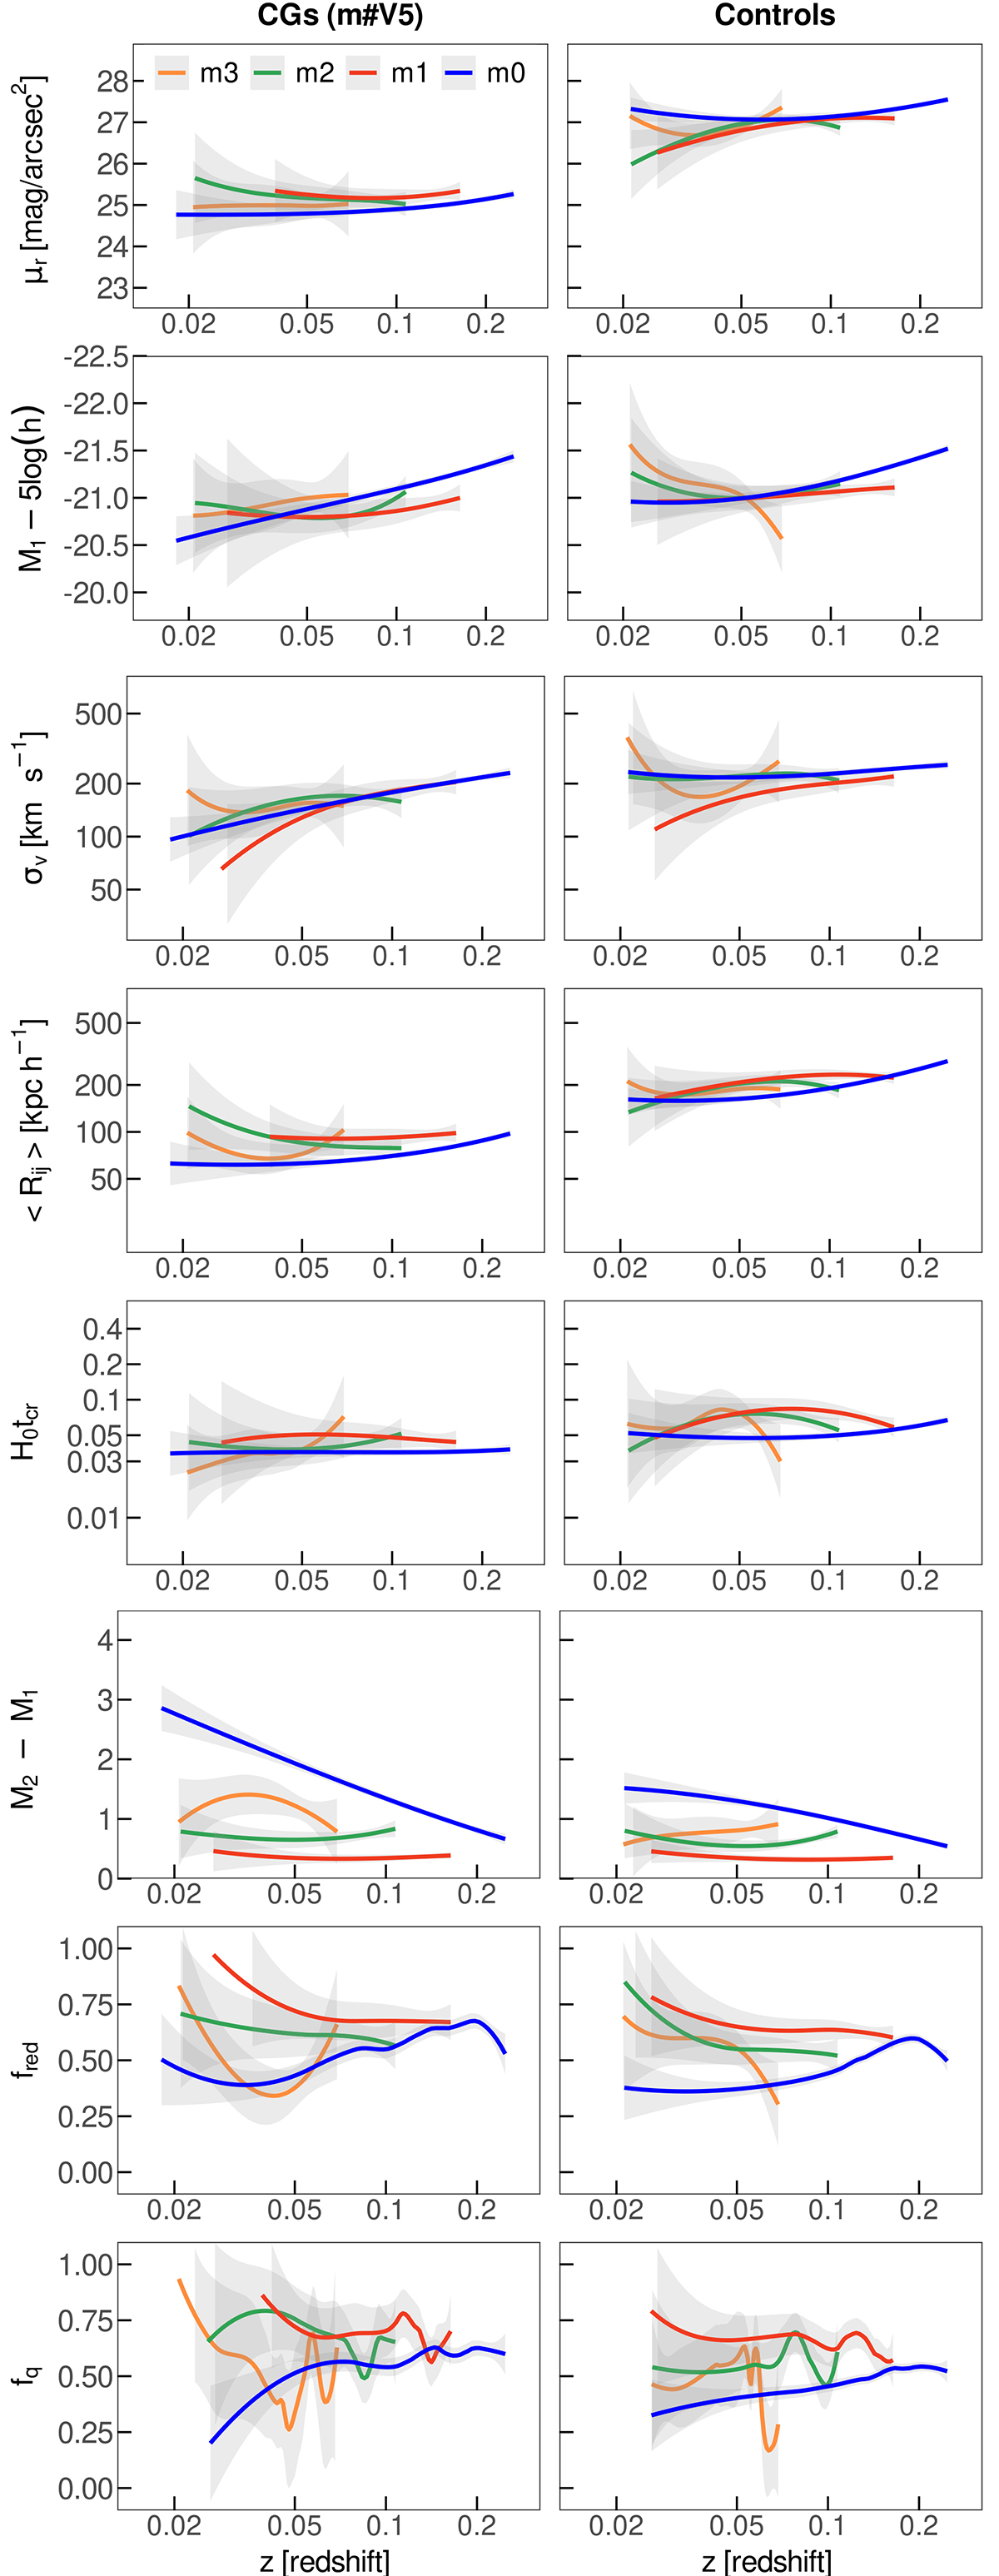
Fig. 8.
Download original image
Group properties as a function of redshift for volume-limited samples. The left column shows CGs, and the right column shows the control groups, both with Vlim = 500 km s−1. The curves are polynomial fittings to the scatter plots displaying roughly median values per redshift bin.
Current usage metrics show cumulative count of Article Views (full-text article views including HTML views, PDF and ePub downloads, according to the available data) and Abstracts Views on Vision4Press platform.
Data correspond to usage on the plateform after 2015. The current usage metrics is available 48-96 hours after online publication and is updated daily on week days.
Initial download of the metrics may take a while.