Fig. 6.
Download original image
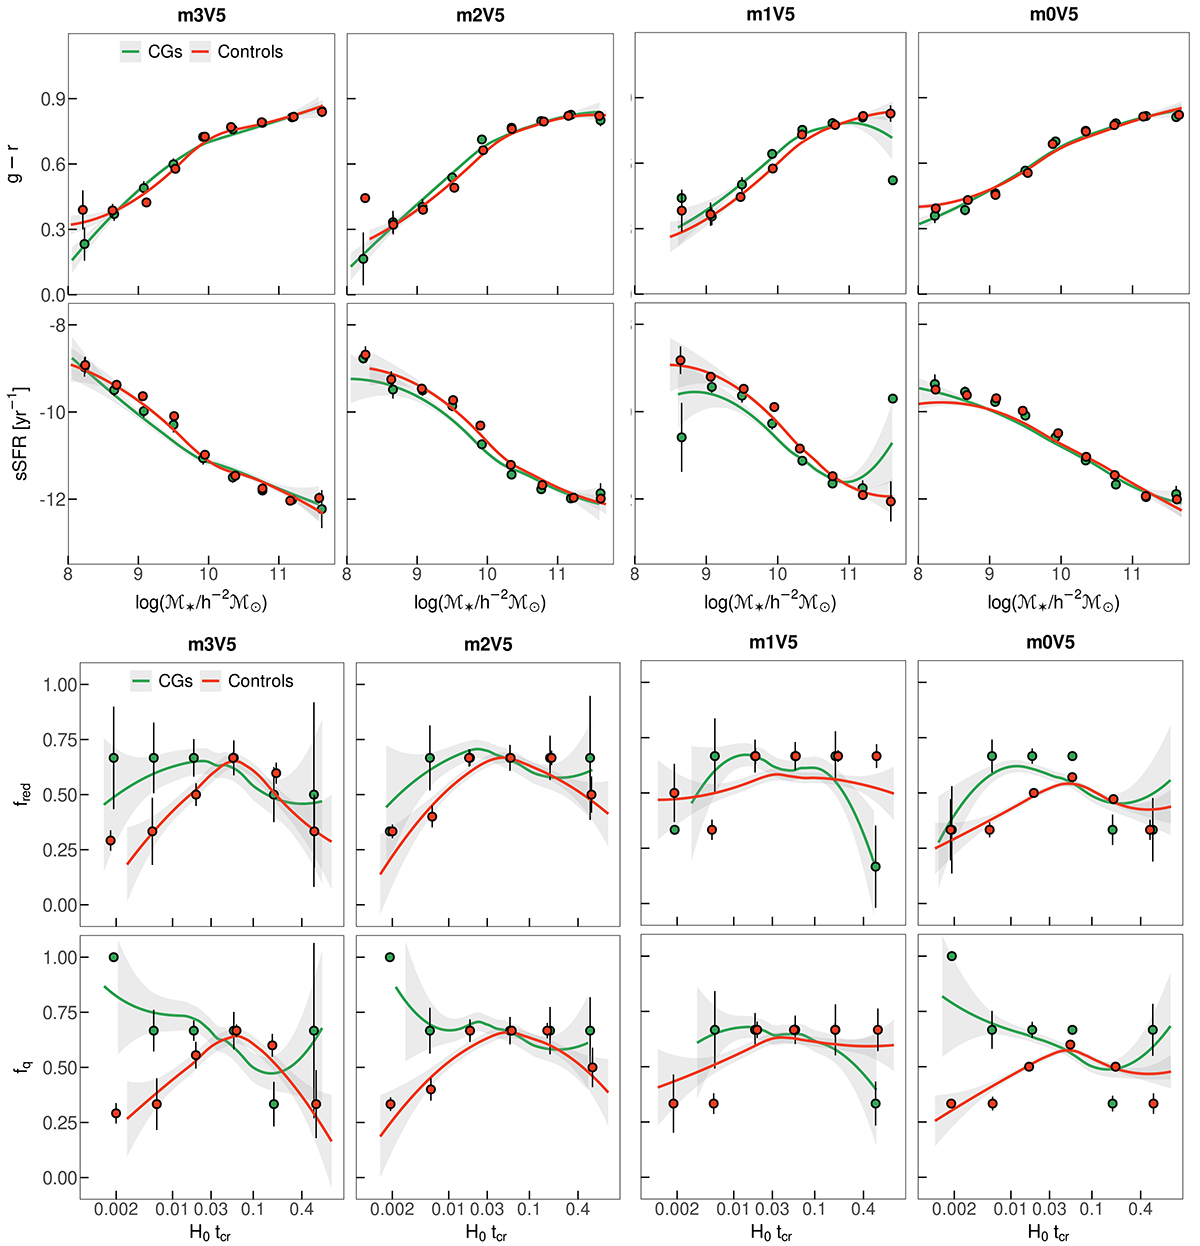
Upper plots: Distribution of the specific star formation rate and colour as a function of galaxy stellar masses for galaxy members in systems. Lower plots: Distribution of the fraction of red and quenched galaxies in systems as a function of their dimensionless crossing time. In all panels, dots represent the median values per bin, and the error bars are the 95% confidence interval for the median. The solid lines show the polynomial fitting to the scatter plot with the LOESS method, and the grey region shows the 95% confidence interval. In each column, the comparison is made between CGs (green) and their control sample (red). Each sample has Vlim = 500 km s−1.
Current usage metrics show cumulative count of Article Views (full-text article views including HTML views, PDF and ePub downloads, according to the available data) and Abstracts Views on Vision4Press platform.
Data correspond to usage on the plateform after 2015. The current usage metrics is available 48-96 hours after online publication and is updated daily on week days.
Initial download of the metrics may take a while.