Fig. 5.
Download original image
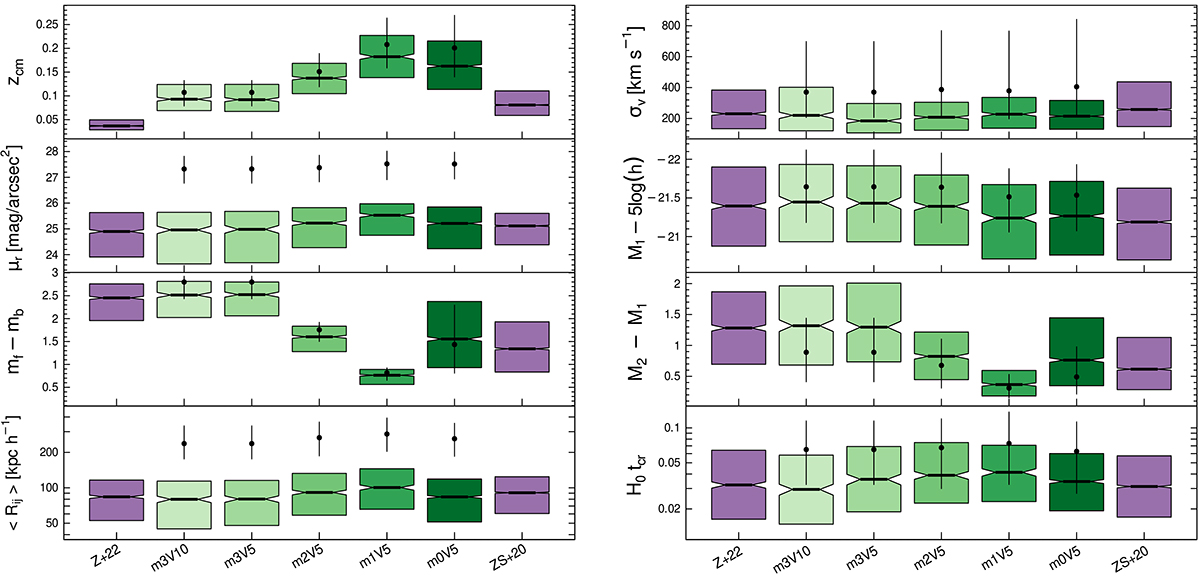
Boxplot diagrams of the properties of CGs. From top left to bottom right: Median redshift of the galaxy members, radial velocity dispersion, surface brightness, absolute magnitude of the brightest galaxy, apparent magnitude difference between the brightest and faintest galaxy, absolute magnitude difference between the two brightest galaxies, median of the projected inter-galaxy distance, and dimensionless crossing time. CGs identified in the GAMA survey are shown in green and are labelled m#V#, where the first index denotes the number of magnitudes used for the magnitude gap, and the second index corresponds to a hundredth of the limit for the velocity concordance criterion. We include the boxplot diagrams of two previous SDSS CG samples in purple for comparison (see Table 1). The dots with bars represent the median properties ± quartile ranges of control groups.
Current usage metrics show cumulative count of Article Views (full-text article views including HTML views, PDF and ePub downloads, according to the available data) and Abstracts Views on Vision4Press platform.
Data correspond to usage on the plateform after 2015. The current usage metrics is available 48-96 hours after online publication and is updated daily on week days.
Initial download of the metrics may take a while.