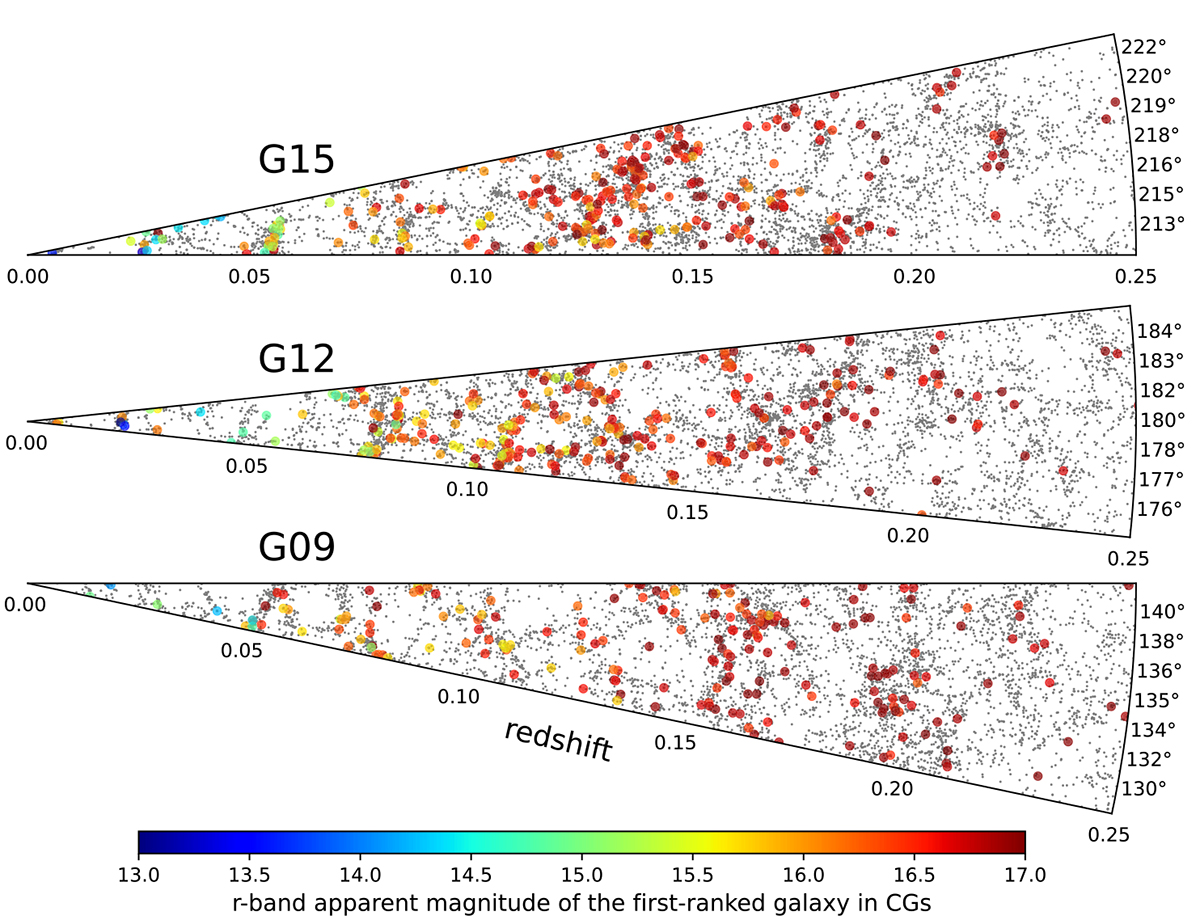
Fig. 4.
Download original image
Spatial distribution of CGs identified in GAMA equatorial fields (large filled dots). In this case, the sample of CGs is the CG-m2V5, i.e. with members within a two-magnitude gap and a maximum velocity separation from the CG centre of 500 km s−1. Each cone displays the CG positions using the right ascension and redshift in each field. The colour distribution shows the r-band apparent magnitude of the brightest galaxy in the CG. The black points show a random sample of galaxies (∼20%) in the main survey.
Current usage metrics show cumulative count of Article Views (full-text article views including HTML views, PDF and ePub downloads, according to the available data) and Abstracts Views on Vision4Press platform.
Data correspond to usage on the plateform after 2015. The current usage metrics is available 48-96 hours after online publication and is updated daily on week days.
Initial download of the metrics may take a while.