Fig. 1.
Download original image
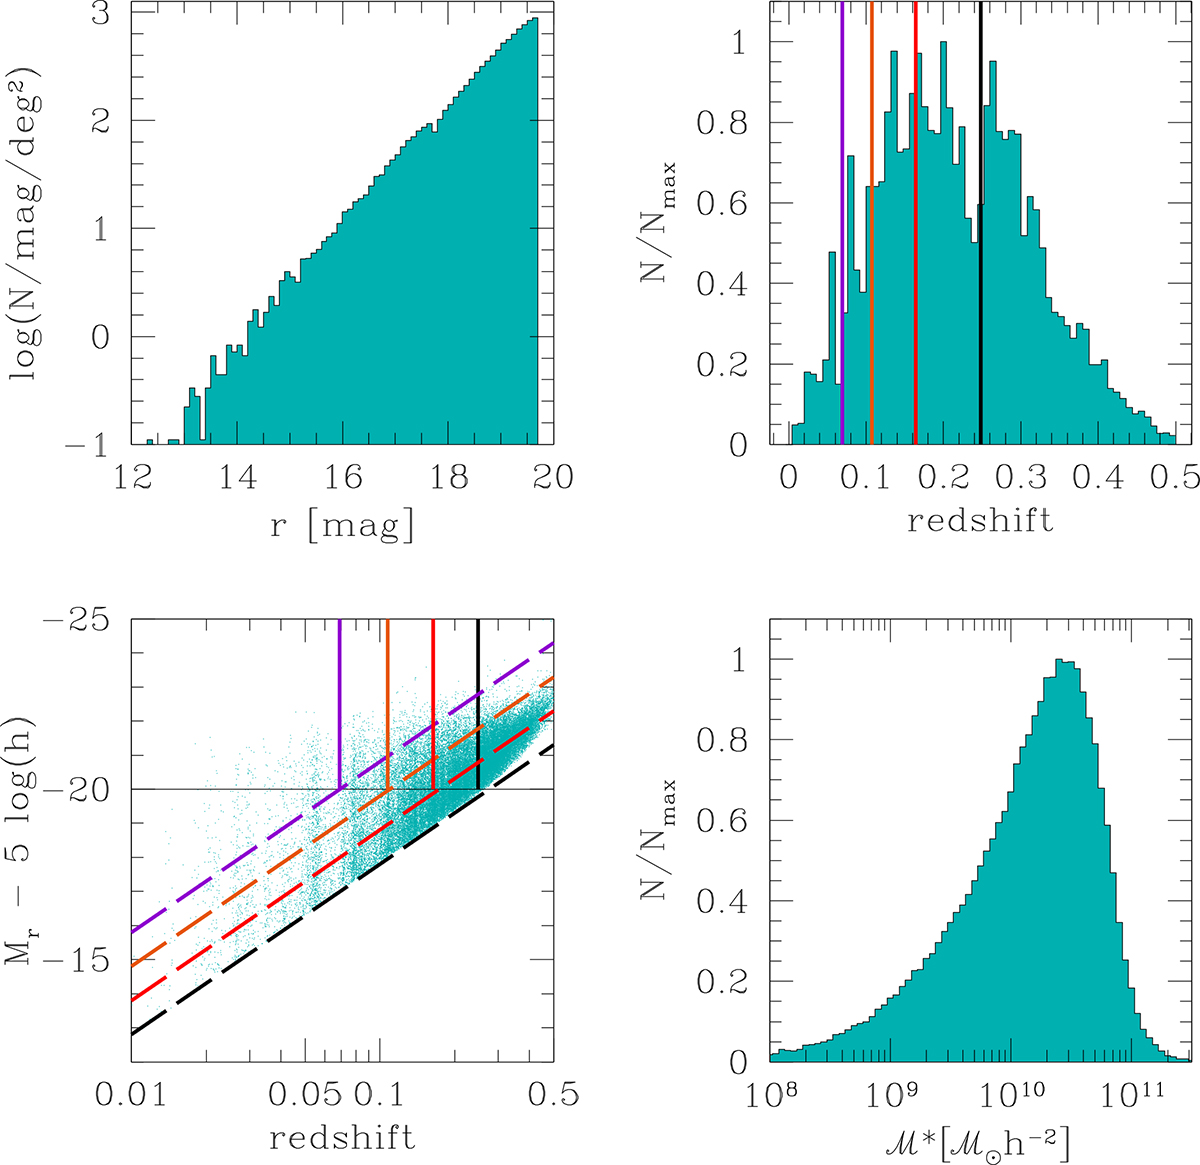
Distribution of properties for GAMA galaxies in the main galaxy sample. In the different panels, we display the galaxy number counts (top left), redshift distribution (top right), absolute magnitude in the r band vs. redshift (bottom left), and the galaxy stellar mass distribution (bottom right). The dashed lines in the bottom left panel show different apparent magnitude limits: 19.7 (black, main catalogue limit) and 18.7, 17.7, and 16.7 (red, orange, and violet). The vertical lines (top right and bottom left panels) represent the redshift limits to define the volume-limited samples used in Sects. 4.4 and 4.5.
Current usage metrics show cumulative count of Article Views (full-text article views including HTML views, PDF and ePub downloads, according to the available data) and Abstracts Views on Vision4Press platform.
Data correspond to usage on the plateform after 2015. The current usage metrics is available 48-96 hours after online publication and is updated daily on week days.
Initial download of the metrics may take a while.