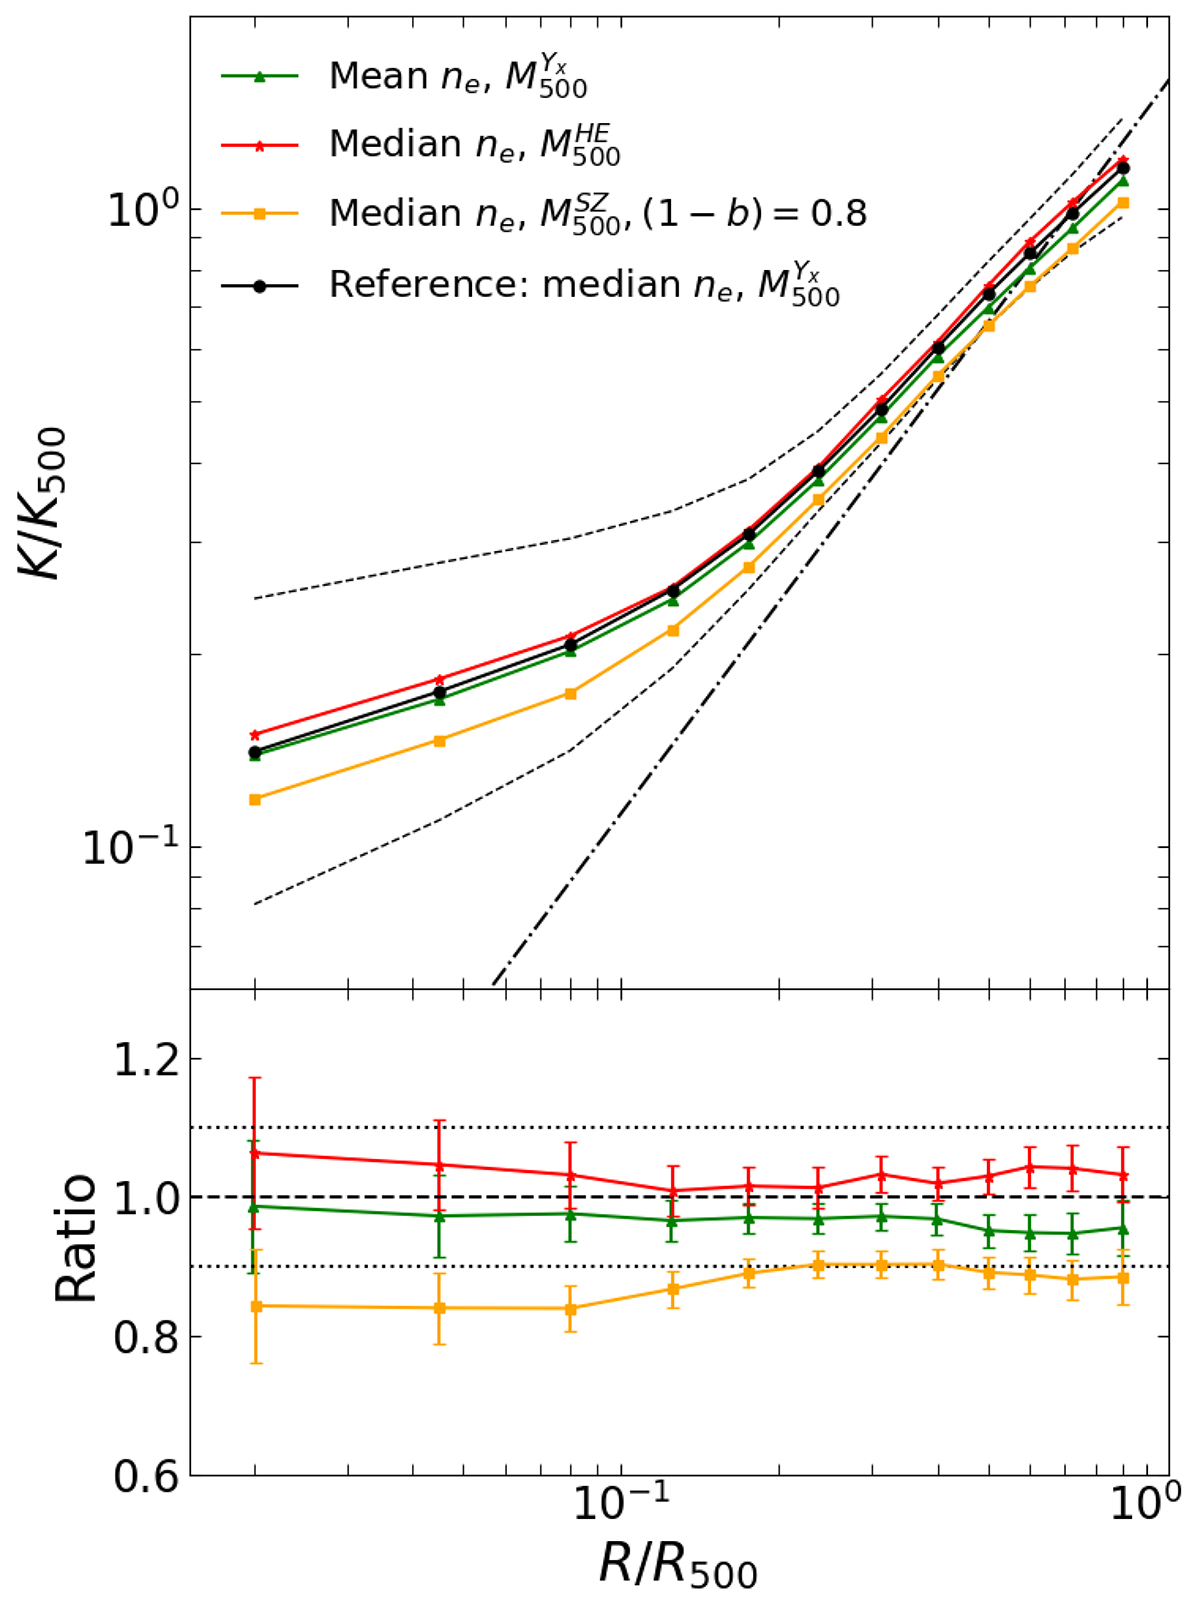
Fig. C.1.
Download original image
Different rescalings presented throughout the paper. In particular, we compare profiles derived with i) mean densities, scaled by M500YX (green triangles); ii) median densities, scaled by ![]() (red stars); iii) median densities, scaled by M500YSZ (1 − b = 0.8; orange squares) to the reference ones, i.e. obtained with median densities and scaled by M500YX (black dots).
(red stars); iii) median densities, scaled by M500YSZ (1 − b = 0.8; orange squares) to the reference ones, i.e. obtained with median densities and scaled by M500YX (black dots).
Current usage metrics show cumulative count of Article Views (full-text article views including HTML views, PDF and ePub downloads, according to the available data) and Abstracts Views on Vision4Press platform.
Data correspond to usage on the plateform after 2015. The current usage metrics is available 48-96 hours after online publication and is updated daily on week days.
Initial download of the metrics may take a while.