Fig. 8.
Download original image
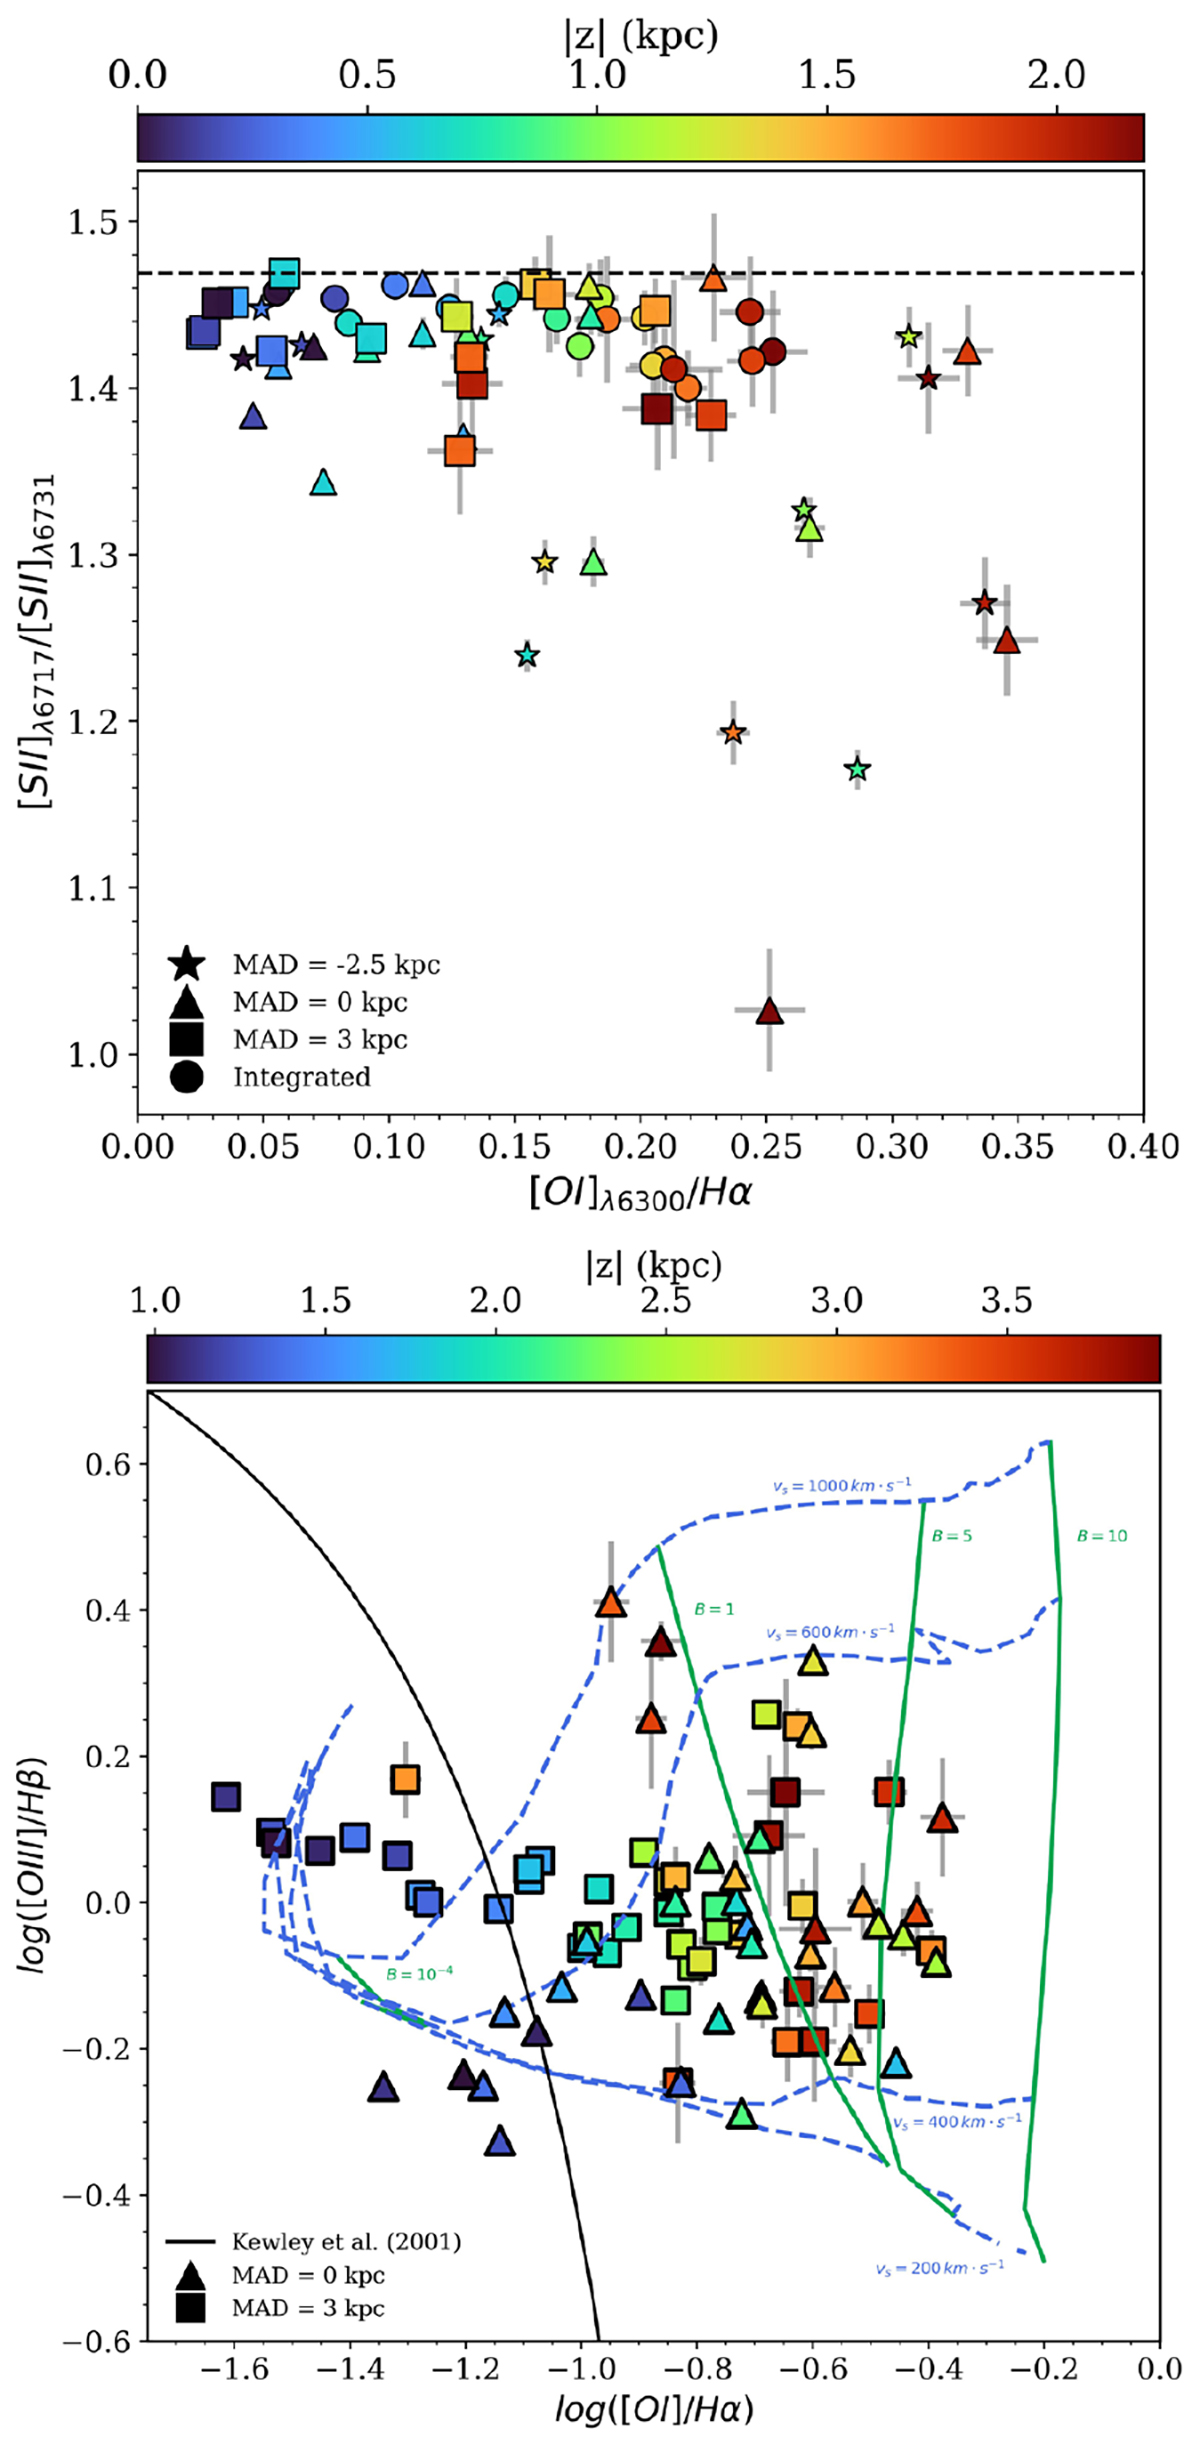
[O I]/Hα vs. line ratios. Top: Electron-density-sensitive [S II]λ 6717/[S II]λ 6731 line ratio vs. shocks-proxy [O I]λ 6300/Hα line ratio for IC1553. The dashed horizontal line represents the theoretical low-density limit for the [S II] doublet, corresponding to 1.469 (Osterbrock & Ferland 2006). Colours and symbols are the same as in Figure 5. Bottom: [O III]/Hβ vs. [O I]/Hα diagnostic diagram for the bins of IC1553 at the minor axis, centred in the biconical structure seen in the [N II]/Hα map (triangles) and in the region within 2.5 < MAD < 4.5 kpc (squares), coincident with the high-level SF region visible in the disc of the galaxy. Curves represent the hybrid model for 40% shocks (without precursor) and 60% star formation with Z = Z⊙ and q = 107 cm/s.
Current usage metrics show cumulative count of Article Views (full-text article views including HTML views, PDF and ePub downloads, according to the available data) and Abstracts Views on Vision4Press platform.
Data correspond to usage on the plateform after 2015. The current usage metrics is available 48-96 hours after online publication and is updated daily on week days.
Initial download of the metrics may take a while.