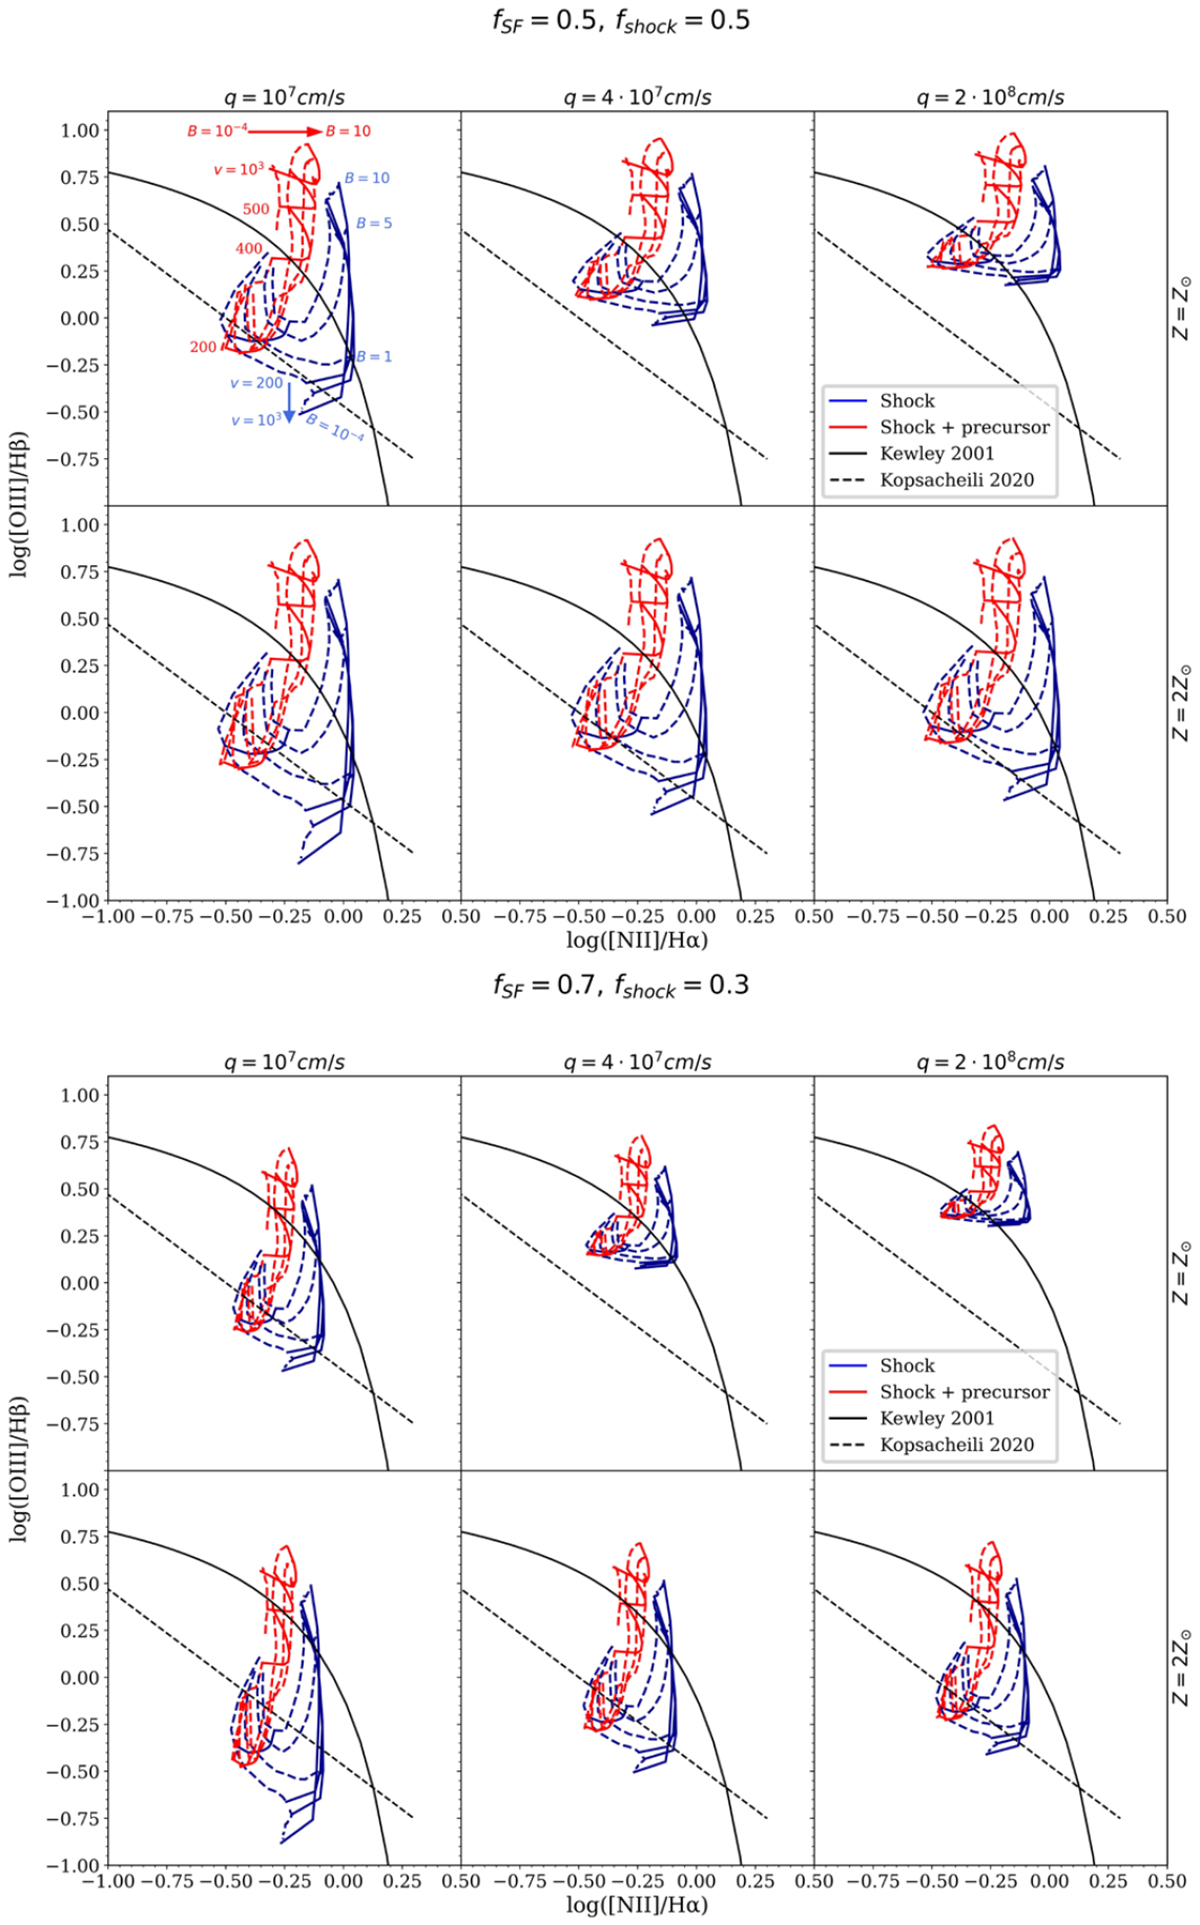
Fig. 6.
Download original image
Showcase star formation + fast shocks hybrid models for the [N II] BPT. The upper panels correspond to the hybrid models with a contribution of fast shocks of 50% and 50% star formation. The lower panels correspond to 30% shocks and 70% star formation. The fast shocks models from Allen et al. (2008) correspond to shock velocities of 200–1000 km/s and magnetic fields of 10−4–10 μG cm3/2, assuming shocks + a precursor (red curves) and only shocks (blue lines). The red arrow indicates the direction of increasing magnetic field in the shocks + precursor models, and the blue arrow indicates the direction of increasing shock velocity in the shock-only models. The dashed oblique line in the [N II]/Hα diagnosis represents the separation of shock excited (e.g. supernova remnants) from photoionised regions (e.g. H II regions) from Kopsacheili et al. (2020). The classic demarcation between H II regions, photoionisation, and AGNs from Kewley et al. (2001) is also plotted in all diagnoses. In every panel is plotted the hybrid models for a fixed metallicity and ionisation parameter: first and second row correspond to Z = Z⊙ and Z = 2 Z⊙, first, second, and third column correspond to q = 107, 4 × 10⁷ and 2 × 108 cm/s, respectively.
Current usage metrics show cumulative count of Article Views (full-text article views including HTML views, PDF and ePub downloads, according to the available data) and Abstracts Views on Vision4Press platform.
Data correspond to usage on the plateform after 2015. The current usage metrics is available 48-96 hours after online publication and is updated daily on week days.
Initial download of the metrics may take a while.