Fig. 5.
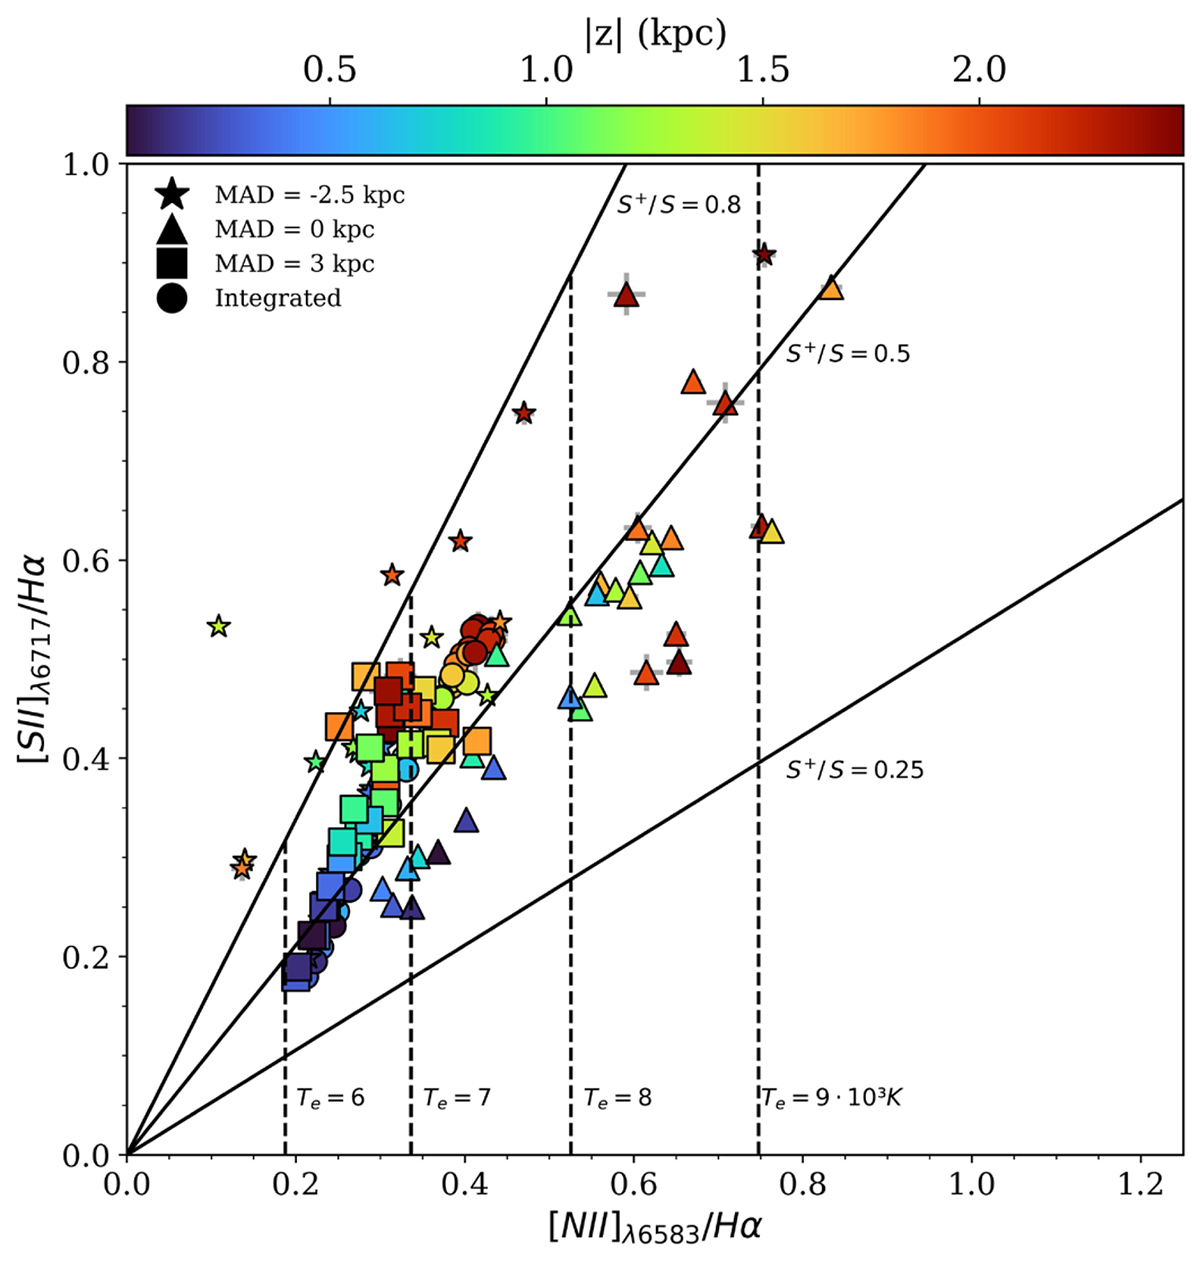
Download original image
[N II]λ 6583/Hα vs. [S II]λ 6717/Hα diagnostic diagram for IC1553. Colours represent height with respect to the midplane, equally from above and below the plane. Vertical dashed lines are the theoretical ratios obtained from Eq. (1) at a constant Te (6, 7, 8, and 9 in units of 103 K). Solid lines represent the theoretical ratios from Equations (1) and (2) for a fixed S+/S (0.25, 0.5, and 0.8, respectively). The circles indicate the line ratios obtained by integrating the fluxes along the major axis at a certain z. Stars, triangles, and squares indicate the line ratio at a certain z for MAD = −2.5, 0, and 3 kpc, respectively.
Current usage metrics show cumulative count of Article Views (full-text article views including HTML views, PDF and ePub downloads, according to the available data) and Abstracts Views on Vision4Press platform.
Data correspond to usage on the plateform after 2015. The current usage metrics is available 48-96 hours after online publication and is updated daily on week days.
Initial download of the metrics may take a while.