Fig. 4.
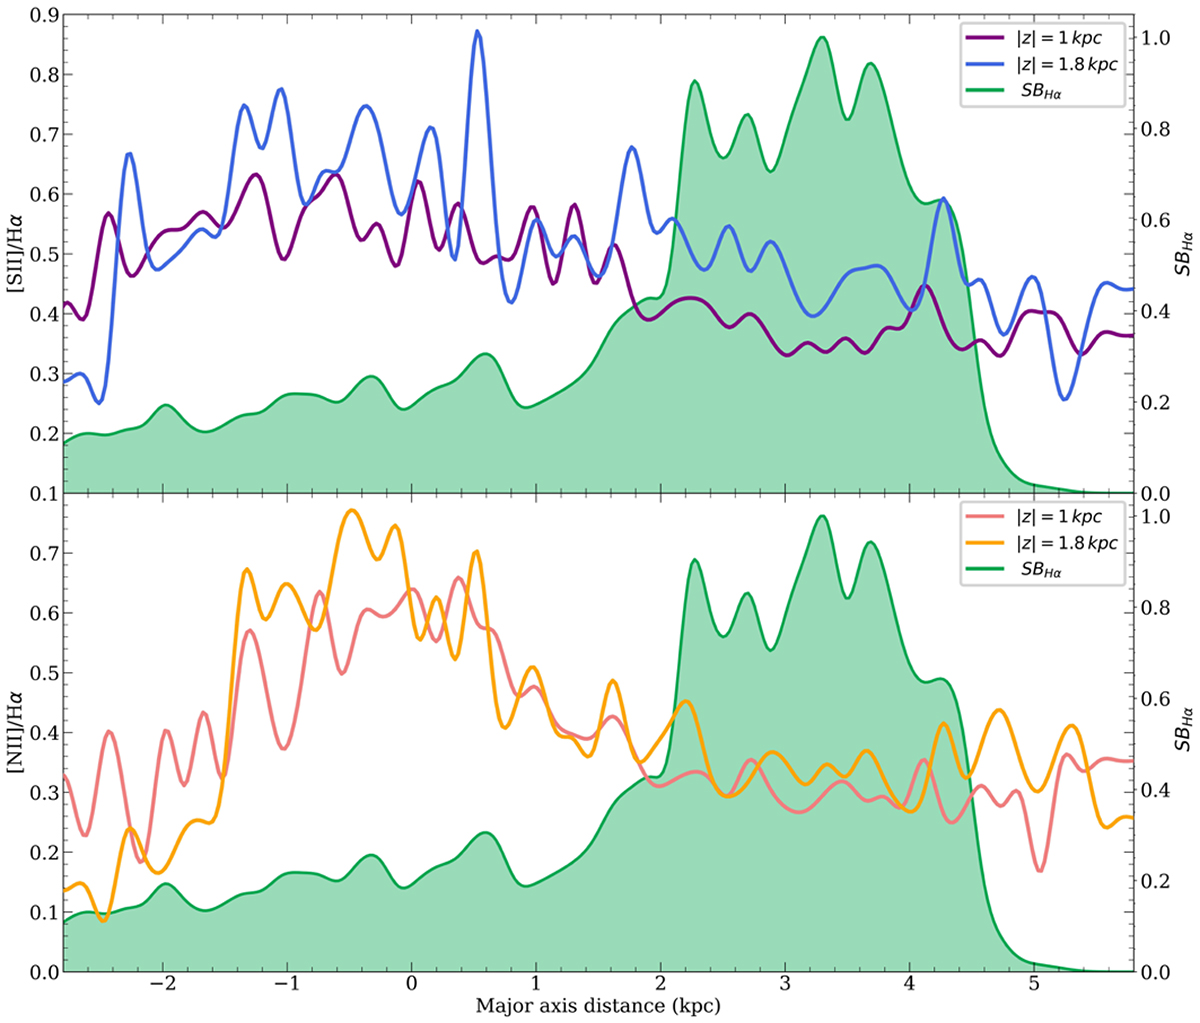
Download original image
Major axis distance distribution of the [N II]/Hα and [S II]/Hα lines for IC1553 at z = 1 and 1.8 kpc. In green, the normalised ΣHα MAD distribution, constructed by integrating the Hα flux within the ellipse fitted in Section 2 throughout the major axis. Both line distributions show a correspondence with the ΣHα distribution, decreasing and showing a greater difference between the two heights as the ΣHα increases. This tendency is consistent for all galaxies.
Current usage metrics show cumulative count of Article Views (full-text article views including HTML views, PDF and ePub downloads, according to the available data) and Abstracts Views on Vision4Press platform.
Data correspond to usage on the plateform after 2015. The current usage metrics is available 48-96 hours after online publication and is updated daily on week days.
Initial download of the metrics may take a while.