Fig. 10.
Download original image
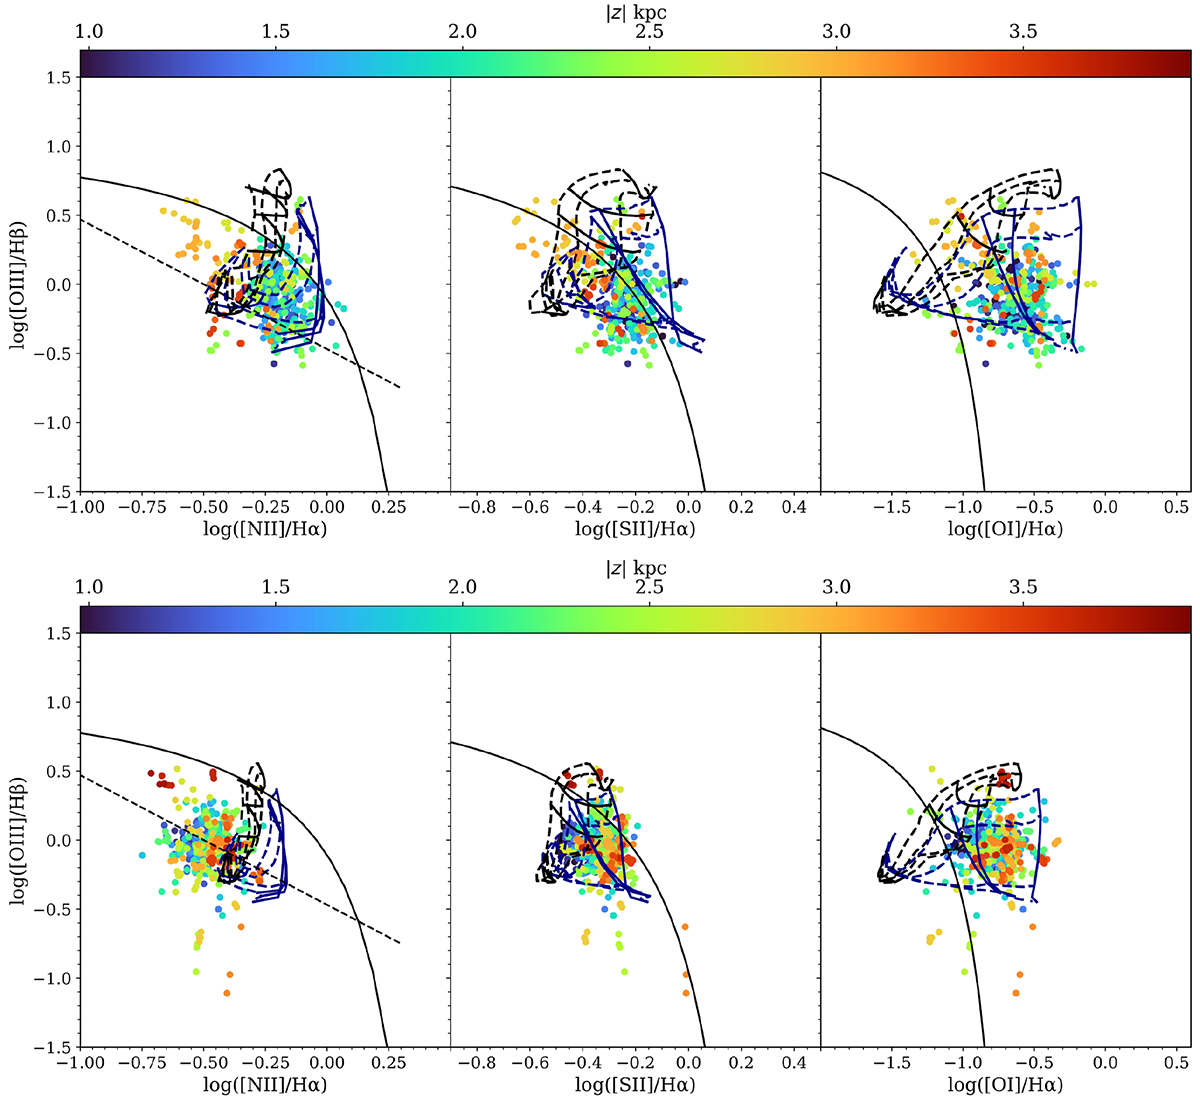
IC1553 BPT with hybrid models, similar to Figure 7. Top: eDIG bins corresponding to the biconical structure seen in the [N II]/Hα map, within −0.5 kpc < MAD < 0.5 kpc. The hybrid models that best fit the data correspond to 40% shocks and 60% SF with Z = Z⊙ and q = 107 cm/s. Bottom: eDIG bins corresponding to the high-SF feature on the southern edge of the disc, within 2.5 kpc < MAD < 3.5 kpc. The hybrid models that best fit the data correspond to 20% shocks and 80% SF with Z = Z⊙ and q = 107 cm/s.
Current usage metrics show cumulative count of Article Views (full-text article views including HTML views, PDF and ePub downloads, according to the available data) and Abstracts Views on Vision4Press platform.
Data correspond to usage on the plateform after 2015. The current usage metrics is available 48-96 hours after online publication and is updated daily on week days.
Initial download of the metrics may take a while.