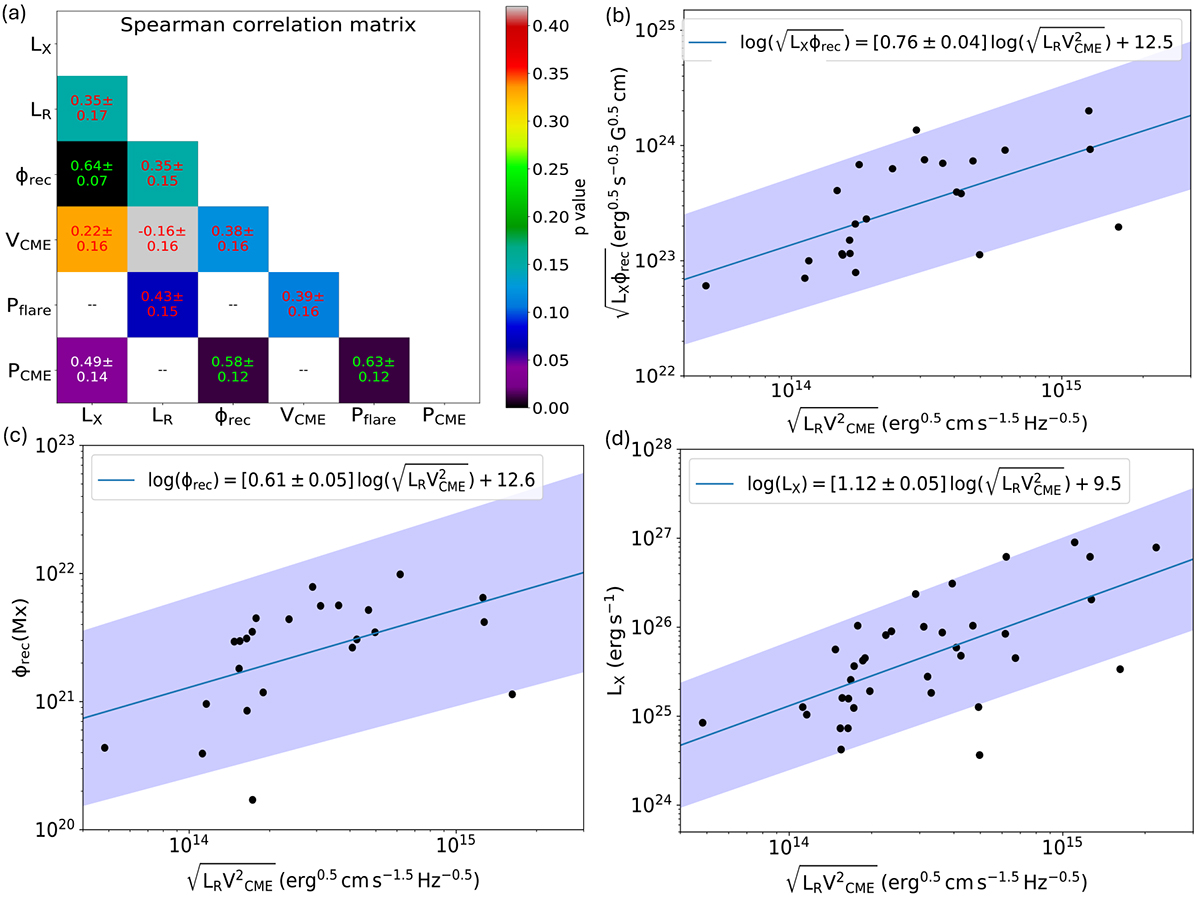
Fig. 2.
Download original image
Cross-correlations and scaling laws between various properties of flare-CME-type II events. (a) Spearman correlation matrix. Each cell provides the Spearmann cross-correlation coefficient (CR, C) between the respective row (R) and column (C) parameters. The cell color represents the p value. The CR, C, error, and p-value were found using a Bootstrapping analysis. The “very significant” (p < 0.015), “significant” (p < 0.05), and “insignificant” (p > 0.05) CR, C values are shown in green, white, and red text, respectively. The CR, C between the novel composite metrics and the respective dependent parameters are masked and marked by “–”. (b) The Pflare − PCME scaling law. (c–d) Relations connecting ϕrec and VCME to PCME. Shaded regions represent the fitting uncertainty intervals.
Current usage metrics show cumulative count of Article Views (full-text article views including HTML views, PDF and ePub downloads, according to the available data) and Abstracts Views on Vision4Press platform.
Data correspond to usage on the plateform after 2015. The current usage metrics is available 48-96 hours after online publication and is updated daily on week days.
Initial download of the metrics may take a while.