Fig. 1
Download original image
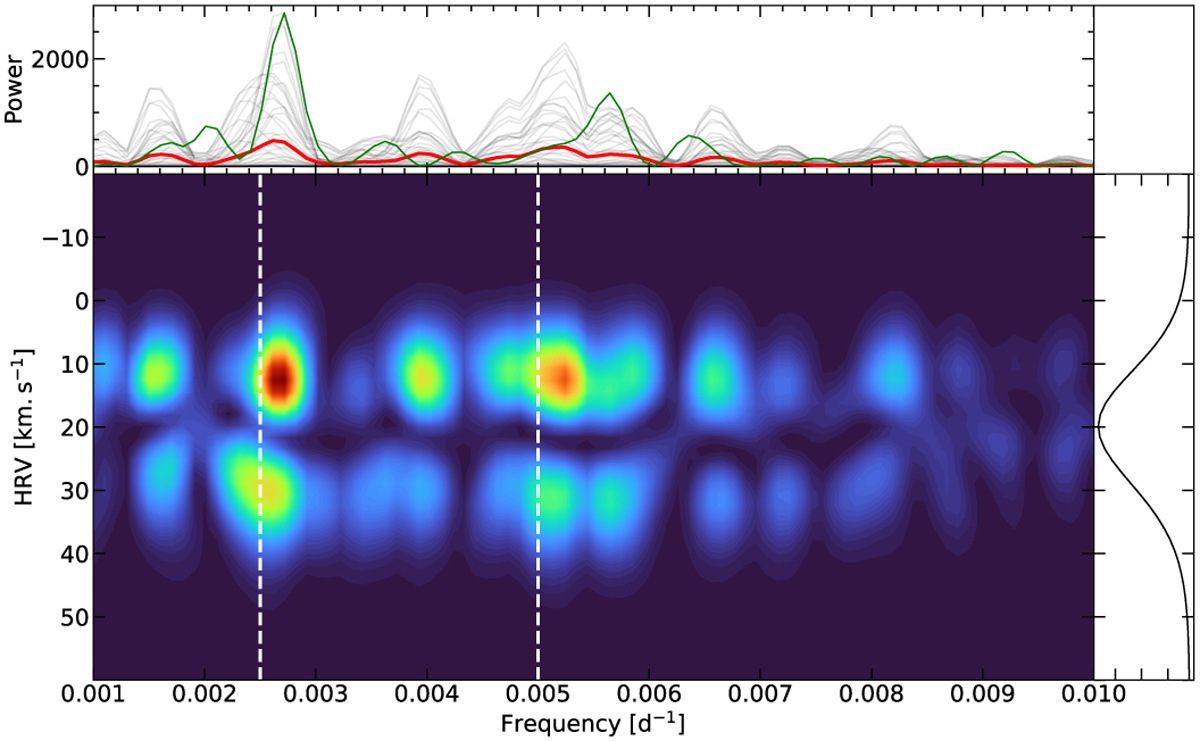
Lomb–Scargle periodogram of the LSD profile of intensity. The upper panel is the Lomb–Scargle periodogram for each velocity bin (gray lines) and the average (red line). The green line is the window function. In the lower panel, the two white dashed lines mark respectively the 400 d and the 200 d periods. The y-axis represents the heliocentric radial velocity (HRV). The color axis marks the power of the fit: red shows a higher power than dark blue. The right panel is the average intensity profile for each velocity bin.
Current usage metrics show cumulative count of Article Views (full-text article views including HTML views, PDF and ePub downloads, according to the available data) and Abstracts Views on Vision4Press platform.
Data correspond to usage on the plateform after 2015. The current usage metrics is available 48-96 hours after online publication and is updated daily on week days.
Initial download of the metrics may take a while.