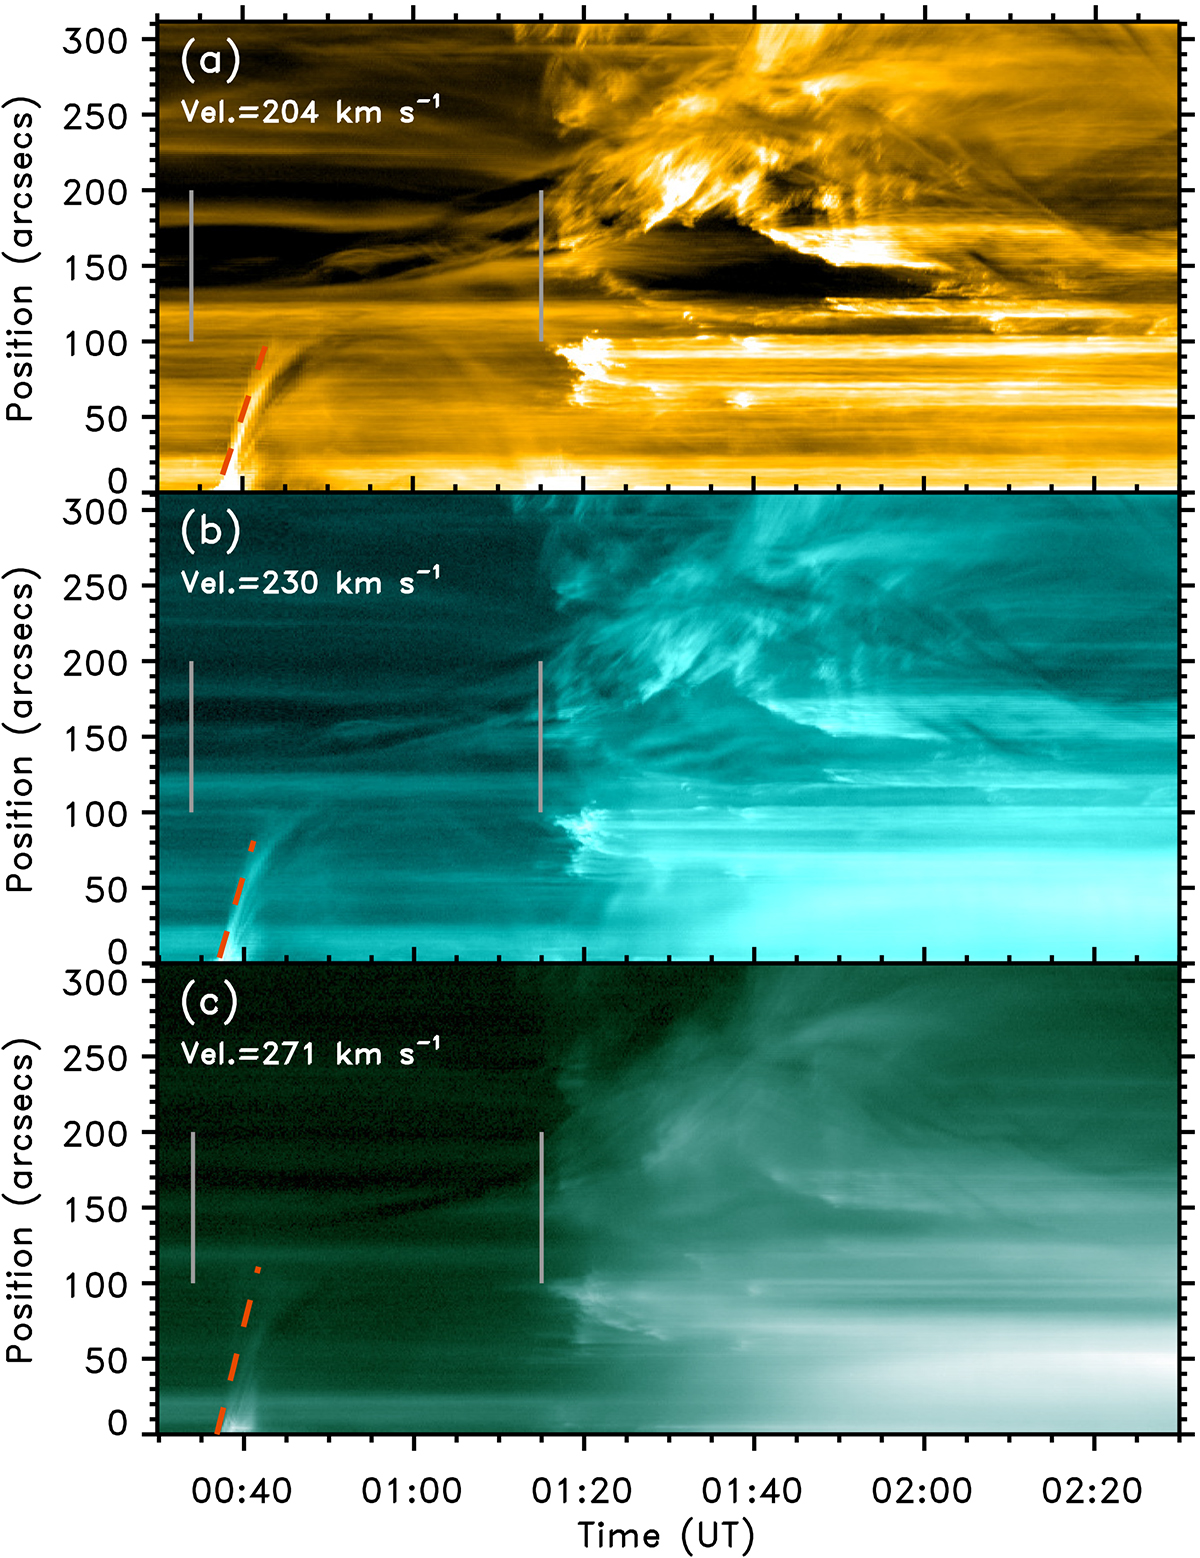
Fig. 9.
Download original image
Time-distance diagram for jet2 along the artificial slit S3 (Fig. 7) in 171 Å (panel a), 131 Å (panel b), and 94 Å (panel c). In all the panels, the two vertical grey lines mark the times of the first C2.4 flare at 00:34UT and the second C9.2 flare starting at 01:15UT. Also in the three panels, by fitting a straight line (red dashed line) we estimate the speed of the jet2 flows on each pass band. The jet2 propagation velocities are shown in each panel. The average value for all three pass bands is 235 km s−1.
Current usage metrics show cumulative count of Article Views (full-text article views including HTML views, PDF and ePub downloads, according to the available data) and Abstracts Views on Vision4Press platform.
Data correspond to usage on the plateform after 2015. The current usage metrics is available 48-96 hours after online publication and is updated daily on week days.
Initial download of the metrics may take a while.