Fig. 8.
Download original image
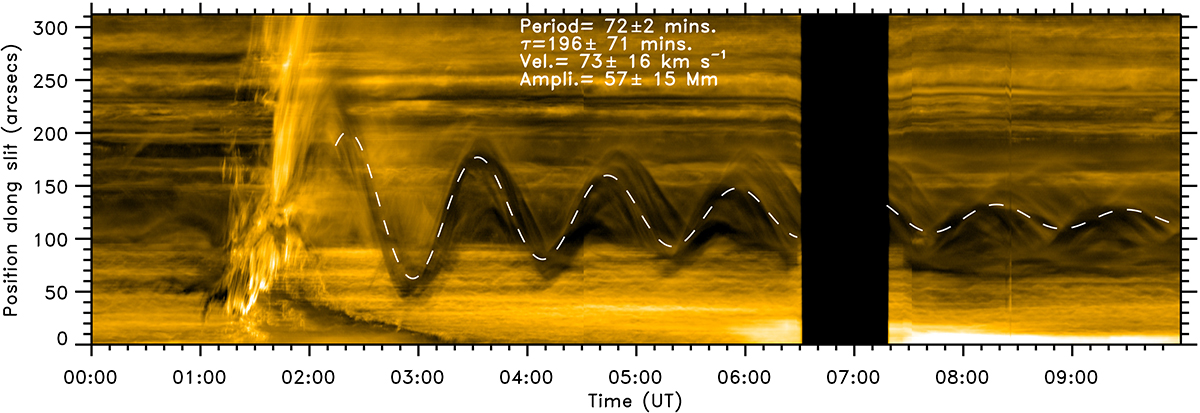
Similar to Fig. 6, but with the time-distance diagram in 171 Å along slit S4 shown. The oscillation best-fit parameters are shown in the figure with the white dashed line. Bright structures are seen between 01:10 and 02:10 UT, which is the impulsive phase when the oscillation is triggered. After 2:10 UT, the absorbing plasma in the filament moves periodically around y = 120 arcsecs. Between 6:30 and 7:20 UT, there is a gap with no SDO data.
Current usage metrics show cumulative count of Article Views (full-text article views including HTML views, PDF and ePub downloads, according to the available data) and Abstracts Views on Vision4Press platform.
Data correspond to usage on the plateform after 2015. The current usage metrics is available 48-96 hours after online publication and is updated daily on week days.
Initial download of the metrics may take a while.