Fig. 6.
Download original image
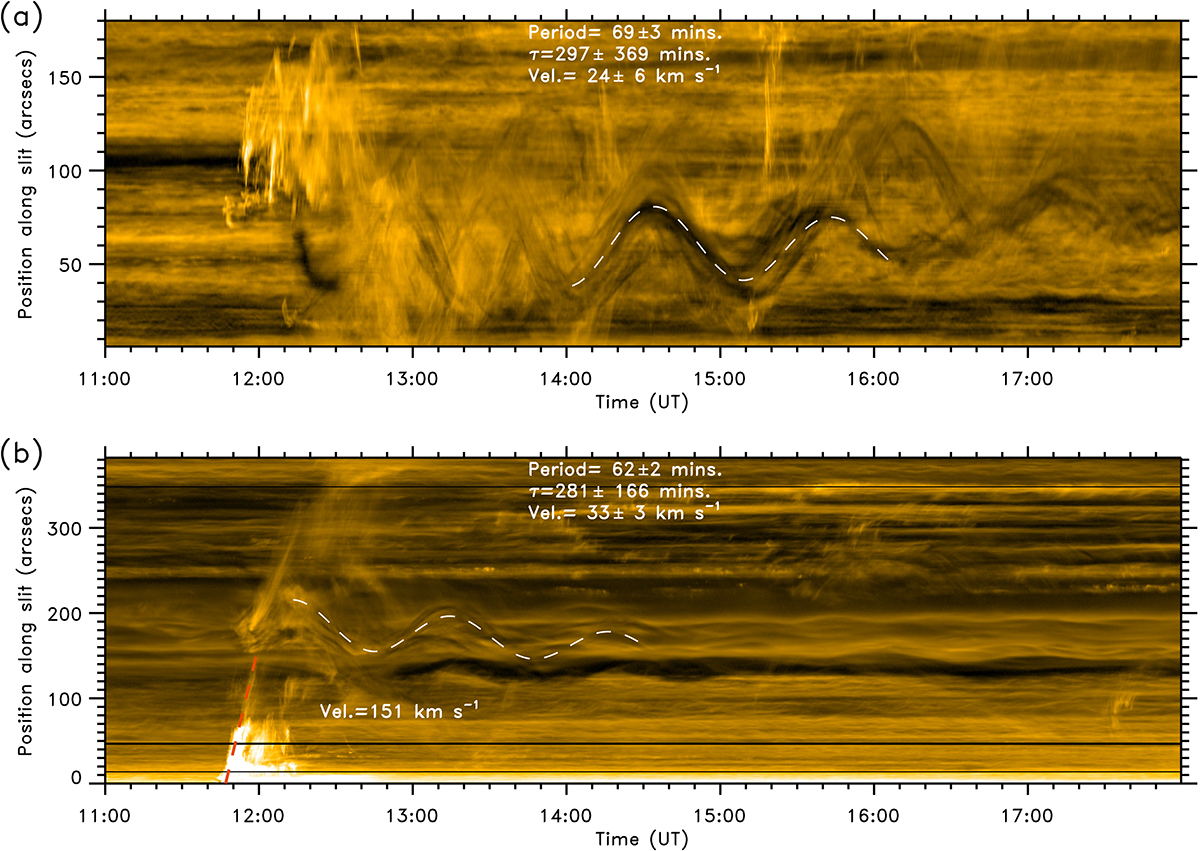
Time-distance diagrams of March 14 constructed with the artificial slits shown in Fig. 5. In panel (a), the diagram for S1 over DF is shown, and in panel (b), the diagram in S2 over RF is shown both panels in AIA 171Å. In this pass band, the prominence plasma appears in absorption as dark bands. The white dashed line shows the oscillation fit using Eq. (1). The best-fit parameters of the oscillation are shown over both panels. In panel (b), the fit is also shown by plotting jet1 with a red dashed line. This gives the jet propagation velocity shown in the panel.
Current usage metrics show cumulative count of Article Views (full-text article views including HTML views, PDF and ePub downloads, according to the available data) and Abstracts Views on Vision4Press platform.
Data correspond to usage on the plateform after 2015. The current usage metrics is available 48-96 hours after online publication and is updated daily on week days.
Initial download of the metrics may take a while.