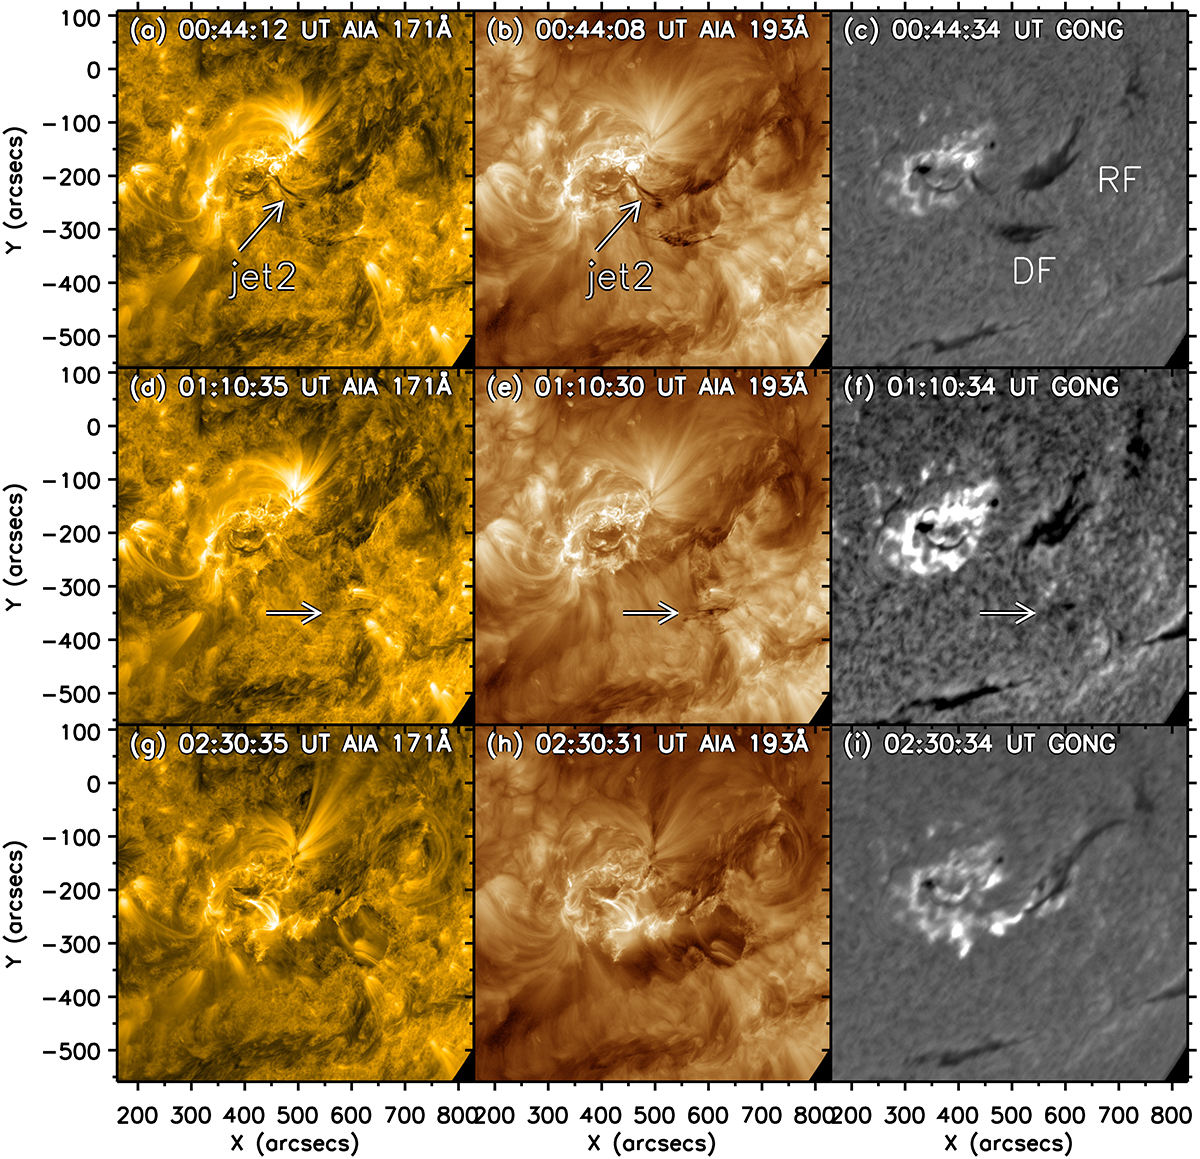
Fig. 3.
Download original image
Temporal evolution on 15 March 2015; similar to Fig. 1. Panels (a) and (b) show the jet2 marked by a white arrow. In both AIA panels, the plasma is seen by absorption. A dark structure is also seen in panel (c). In panel (c), the two filament segments are seen. Jet2 hits DF and triggers its eruption. In the middle row, DF (white arrow) is slowly rising. In the last column, the fulguration associated with the DF eruption is occurring. In (g) and (h), the postflare loops are visible. In panel (i), chromospheric brightenings are also seen. These brightenings form two ribbons, one north and one south, although the shape is not well defined. It is clearer in later times and we recommended consulting the animation accompanying this figure. In panel (i), the RF segment has an elongated shape because it is pushed in a NW direction. An animation of this figure is available online.
Current usage metrics show cumulative count of Article Views (full-text article views including HTML views, PDF and ePub downloads, according to the available data) and Abstracts Views on Vision4Press platform.
Data correspond to usage on the plateform after 2015. The current usage metrics is available 48-96 hours after online publication and is updated daily on week days.
Initial download of the metrics may take a while.