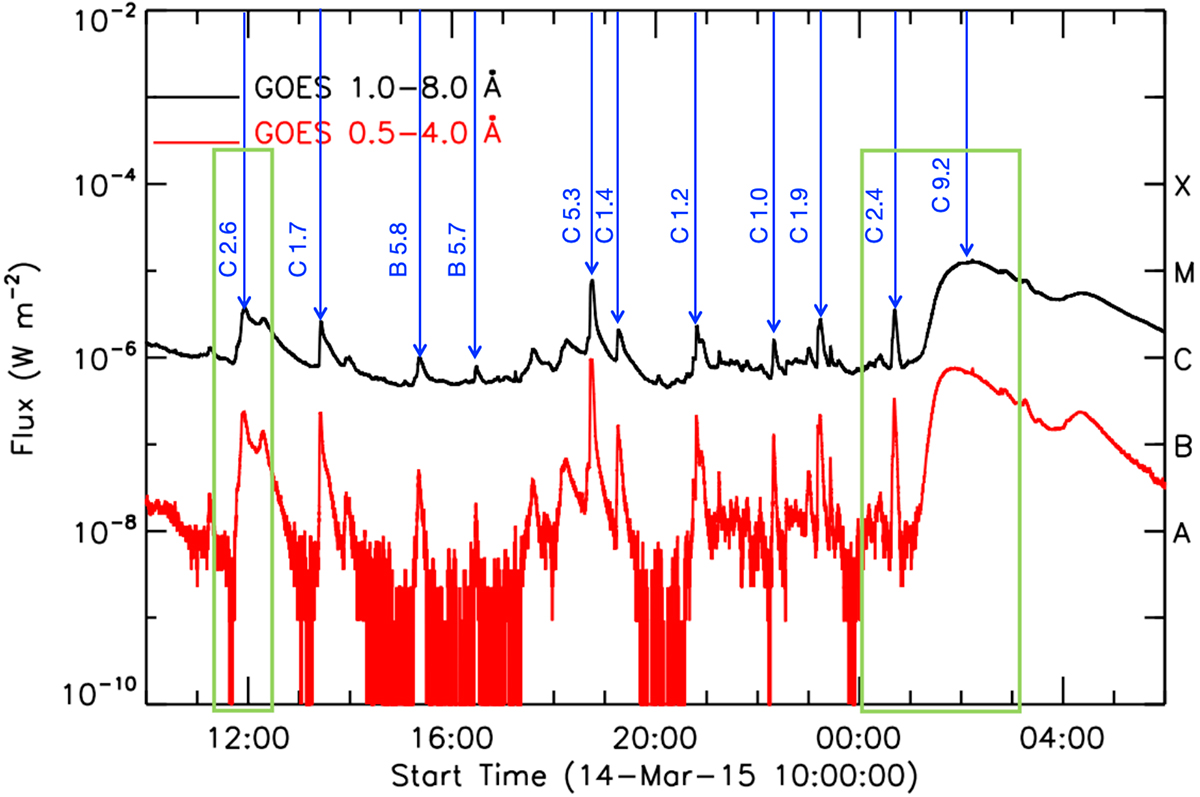
Fig. 2.
Download original image
Succession of flares from AR 12297 on March 14–15 2015 registered by GOES. The GOES classification of flares measures the peak flux in the 1–8 Å range (black curve) and in the 0.5–4 Å range (red curve). The vertical blue arrows show the recurring solar flares from AR 12297 for the period from March 14 10:00 UT until March 15 6:00 UT. The two green boxes delimit the two flare events we are interested in. The first event contains one C2.6 flare, whereas the second includes two flares, of class C2.4 and C9.2, respectively. Jet1 occurs almost simultaneously after the C2.6 flare on day 14, whereas jet2 erupts just after flare C2.4 on day 15.
Current usage metrics show cumulative count of Article Views (full-text article views including HTML views, PDF and ePub downloads, according to the available data) and Abstracts Views on Vision4Press platform.
Data correspond to usage on the plateform after 2015. The current usage metrics is available 48-96 hours after online publication and is updated daily on week days.
Initial download of the metrics may take a while.