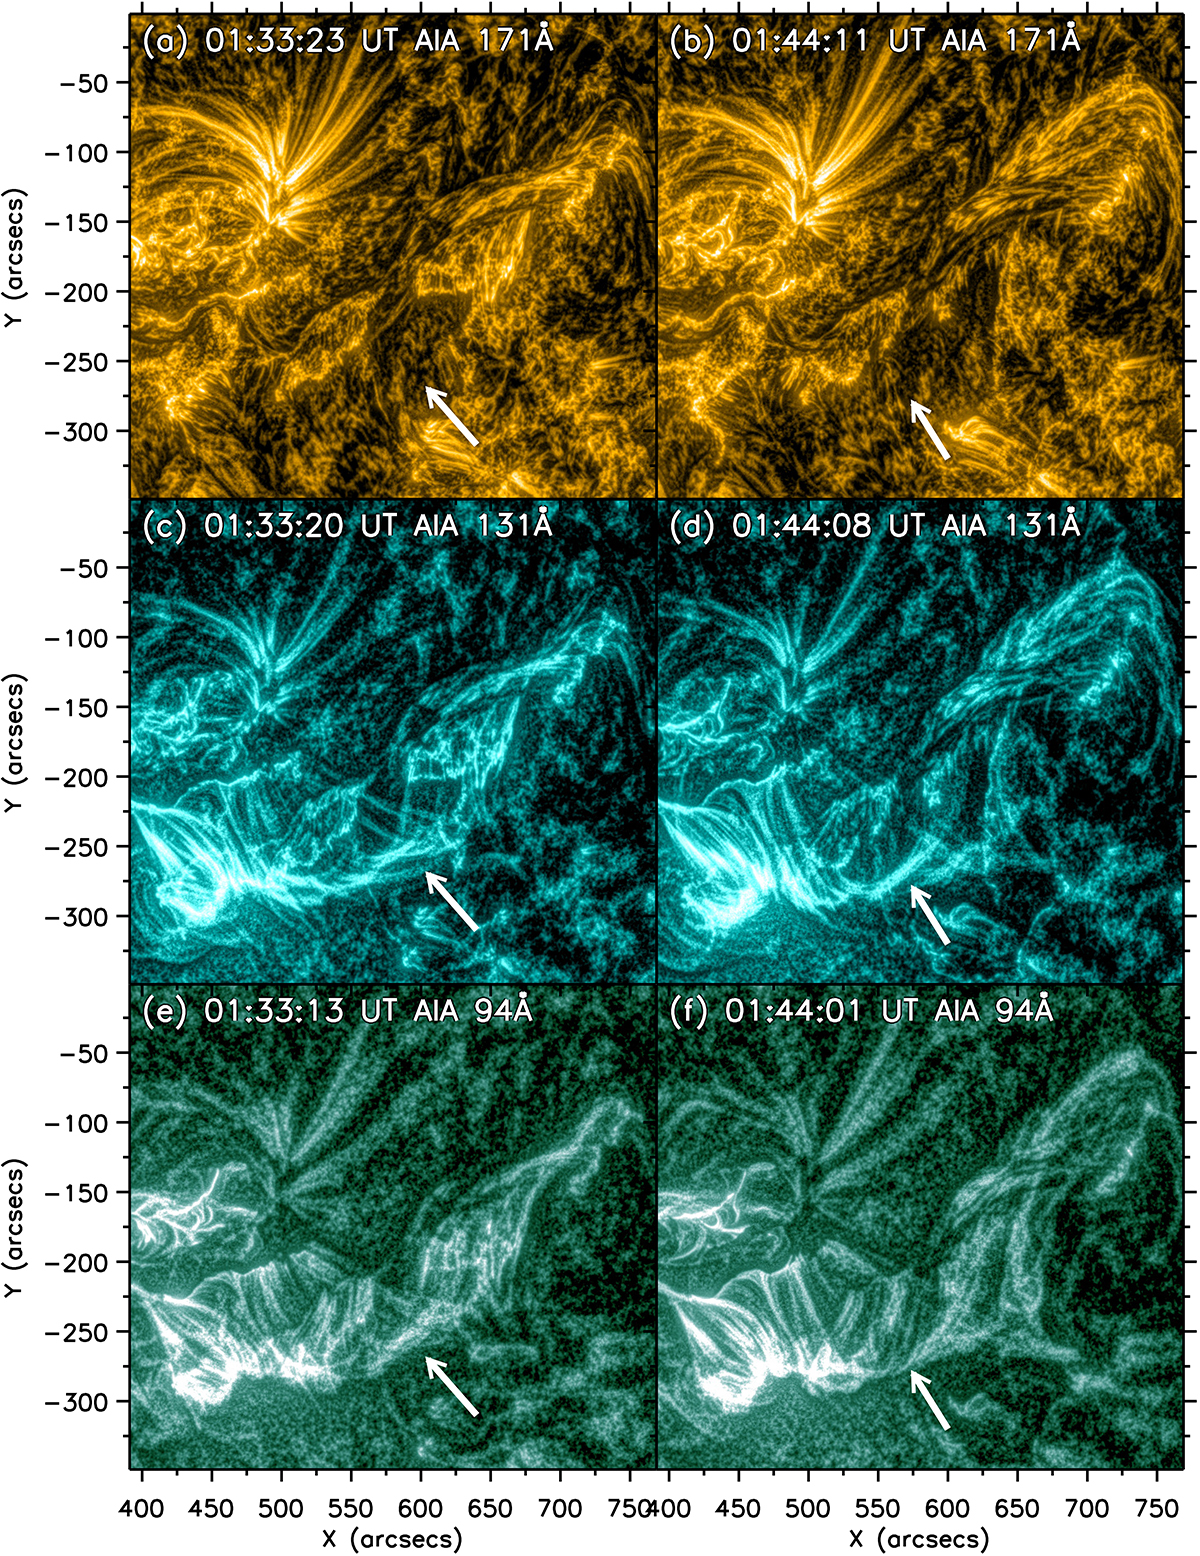
Fig. 10.
Download original image
Plot showing two moments during triggering of huge oscillation in AIA 171 Å, 131 Å, and 94 Å. The images have been processed using the WOW technique described in Sect. 2. The left column shows the region at 1:33 UT. In 171 Å (a) the structures already discussed in Fig. 4 are visible. In 131 Å (c), however, the post-flare loops around the flare are visible, as well as bright tubes in this pass band from the flare area to the filament. The white arrows indicate the region where the bright tubes appear in 131 Å and 94Å. These appear to trace a twisted field line reminiscent of a magnetic rope. Similar structures can be seen in 94 Å (e). Later, in the right column, the structure has evolved, but the bright tubes connecting to the prominence at both wavelengths are still clear. We note that these bright tubes are not visible in 171 Å. In 171 Å, the white arrows show the areas where the tubes appear in 131 Å and 94 Å. An animation of this figure is available online.
Current usage metrics show cumulative count of Article Views (full-text article views including HTML views, PDF and ePub downloads, according to the available data) and Abstracts Views on Vision4Press platform.
Data correspond to usage on the plateform after 2015. The current usage metrics is available 48-96 hours after online publication and is updated daily on week days.
Initial download of the metrics may take a while.