Fig. 1.
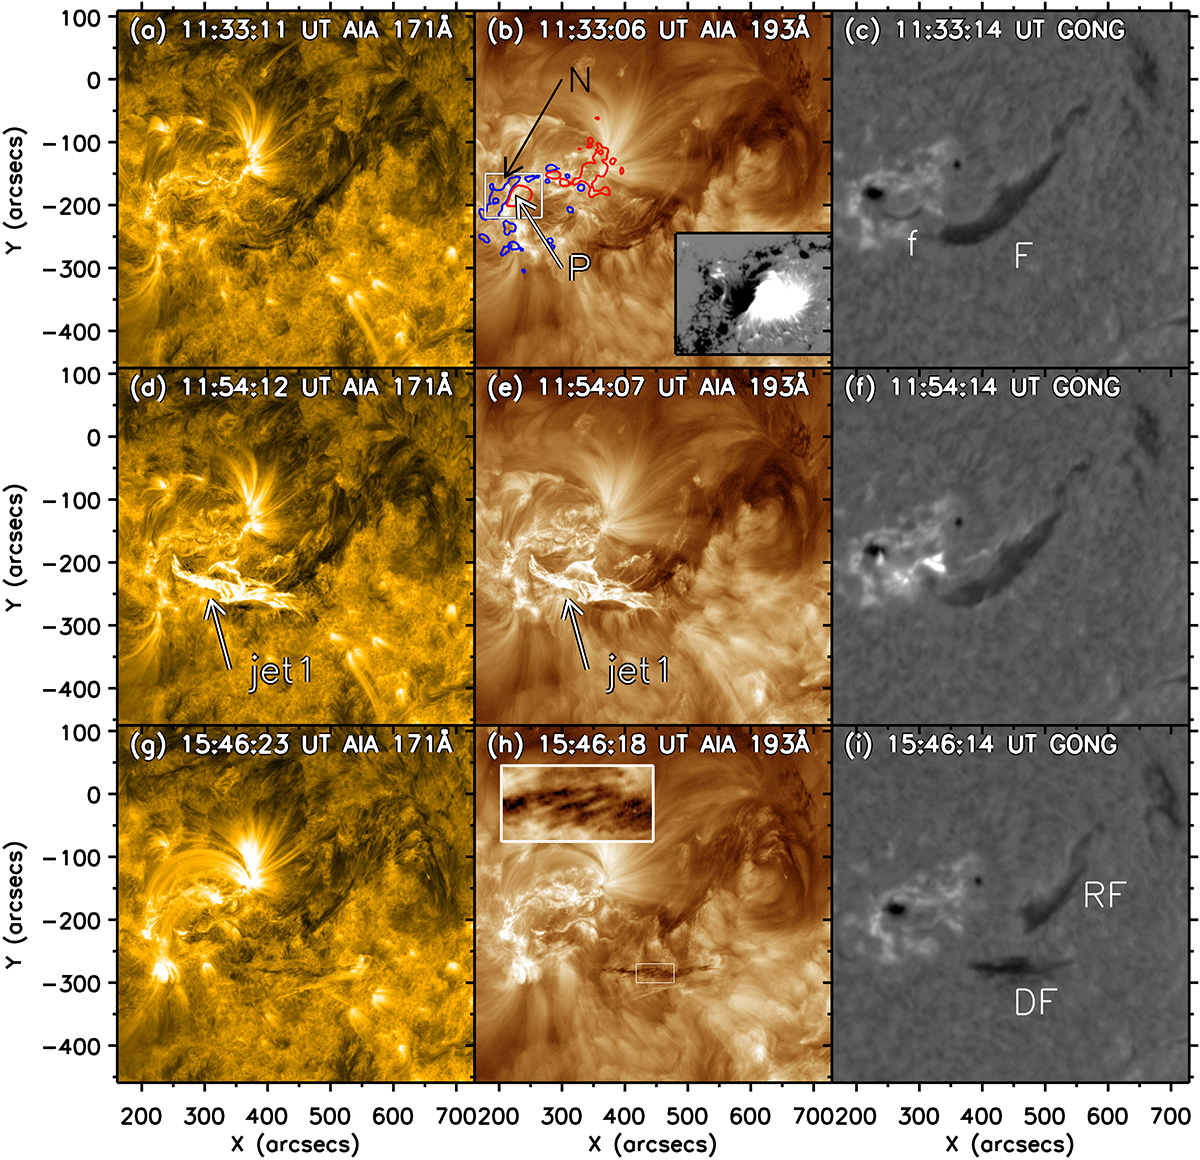
Download original image
Temporal evolution on 14 March 2015 in SDO-AIA 171 Å (left column), 193 Å (central column), and in GONG Hα (right column). In panel (b), the images are overlaid with the HMI magnetogram of the AR. In the same panel, an inset shows a detail of the HMI magnetogram around the AR central bipole. It consists of a bipole with a positive polarity (P, in red) surrounded by negative polarities (N, in dark blue). In panel (c), the image is shown in Hα with a large F filament studied in this work and a small f filament in the AR. The f eruption is related to the first jet on this day. In panels (d) and (e), jet1 appears as a bright structure, marked with the white arrow. It is visible in the AIA pass bands, but not in the Hα; see panel (f). After the impact of the jet1, the F filament splits into two segments. In the AIA channels ((g) and (h)), both parts can be seen, but it is much clearer in Hα (i). The segments are labelled RF and DF. The DF segment detaches from the body of the initial filament and is ejected up and towards the south. This segment will erupt the next day. In panel (h), inset, a detail of DF is shown. This reveals the structure of the filament in the form of threads oriented along the NW direction. An animation of this figure is available online.
Current usage metrics show cumulative count of Article Views (full-text article views including HTML views, PDF and ePub downloads, according to the available data) and Abstracts Views on Vision4Press platform.
Data correspond to usage on the plateform after 2015. The current usage metrics is available 48-96 hours after online publication and is updated daily on week days.
Initial download of the metrics may take a while.