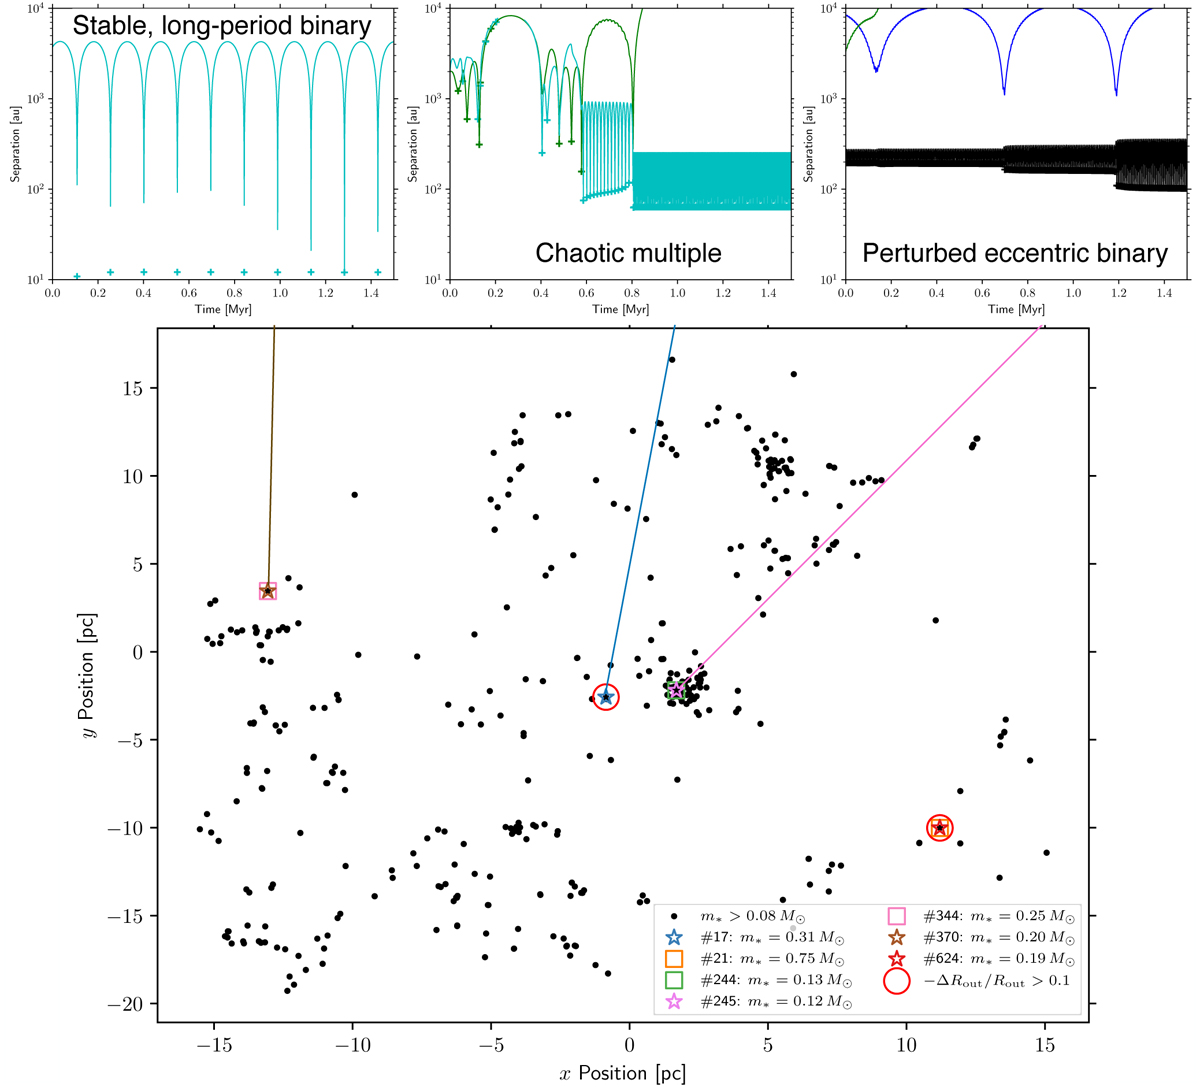
Fig. 9
Download original image
Spatial distribution of stars (mass > 0.08 M⊙) at 1 Myr and contemporary disc-truncating encounters in our simulation. We show as coloured star or square symbols the location of all stars that underwent encounters yielding a fractional truncation −∆Rout/Rout > 0.01 over the age range 1 ± 0.2 Myr. Encounters that yielded −∆Rout/Rout > 0.1 are highlighted with red circles. In the panels along the top we show the separation between specific stars and their stellar neighbours over the first 1.5 Myr of the simulation. Each line represents the distance to a single stellar neighbour, linearly interpolated between snapshots, where neighbours that are one of the two closest stars at any given time step are included (if they pass within 104 au). In each plot, we mark the location of a logged ‘closest approach’ as a cross (inferred analytically from the closest time step – see Section 3.10).
Current usage metrics show cumulative count of Article Views (full-text article views including HTML views, PDF and ePub downloads, according to the available data) and Abstracts Views on Vision4Press platform.
Data correspond to usage on the plateform after 2015. The current usage metrics is available 48-96 hours after online publication and is updated daily on week days.
Initial download of the metrics may take a while.