Open Access
Fig. 8
Download original image
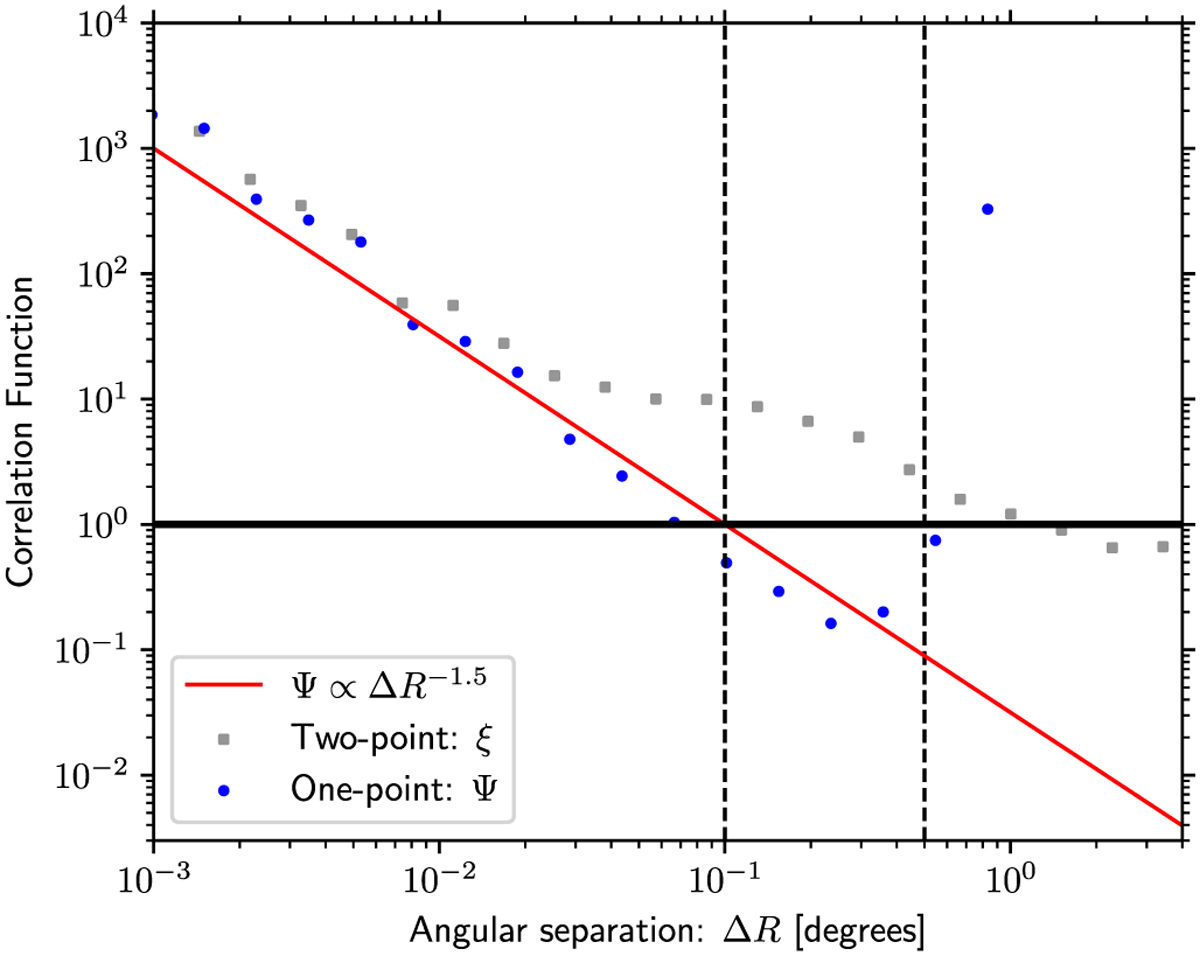
One-point (Ψ, blue points) and two-point (ξ, grey points) correlation functions computed from our model at 1 Myr. The red line shows the Ψ ∝ ∆R−1.5 relationship for ∆R < 0.2° and the two dashed black lines enclose the region of inhibition (where Ψ < 1), as inferred by Joncour et al. (2017, see their Figure 4).
Current usage metrics show cumulative count of Article Views (full-text article views including HTML views, PDF and ePub downloads, according to the available data) and Abstracts Views on Vision4Press platform.
Data correspond to usage on the plateform after 2015. The current usage metrics is available 48-96 hours after online publication and is updated daily on week days.
Initial download of the metrics may take a while.