Fig. 6
Download original image
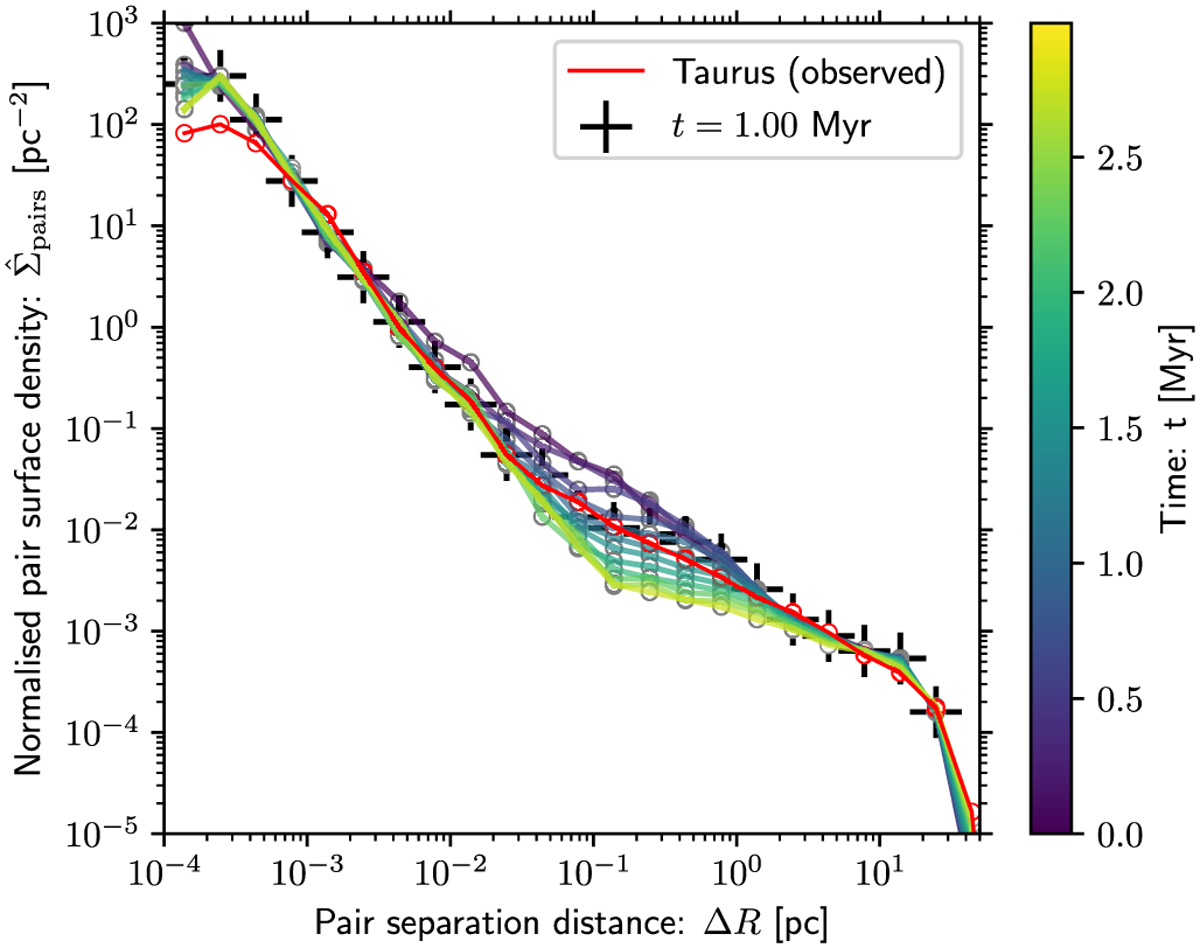
Normalised pair surface density ![]() as a function of projected separation ∆R in parsecs. The red line shows the observed surface density for Taurus from the Luhman (2023) census, which may be incomplete at the smallest separations. The coloured lines show the outcome from our model, at snapshot outputs indicated by the colour bar. The 1 Myr snapshot is also marked by black crosses, at which time the pair distribution function is in good agreement between observations and simulation.
as a function of projected separation ∆R in parsecs. The red line shows the observed surface density for Taurus from the Luhman (2023) census, which may be incomplete at the smallest separations. The coloured lines show the outcome from our model, at snapshot outputs indicated by the colour bar. The 1 Myr snapshot is also marked by black crosses, at which time the pair distribution function is in good agreement between observations and simulation.
Current usage metrics show cumulative count of Article Views (full-text article views including HTML views, PDF and ePub downloads, according to the available data) and Abstracts Views on Vision4Press platform.
Data correspond to usage on the plateform after 2015. The current usage metrics is available 48-96 hours after online publication and is updated daily on week days.
Initial download of the metrics may take a while.