Fig. 2
Download original image
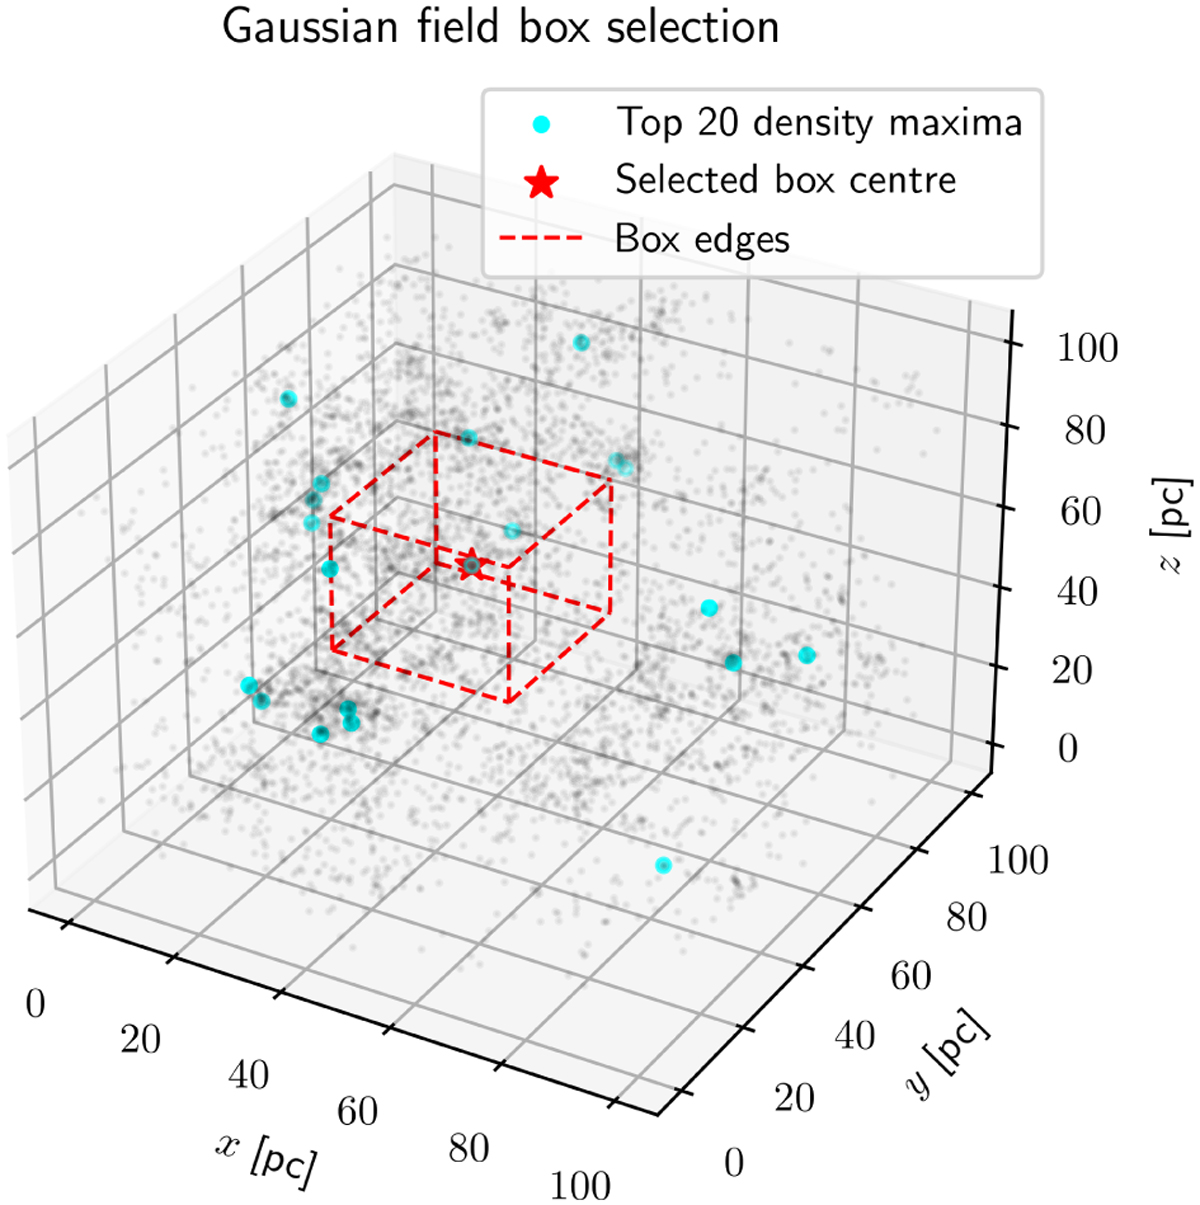
Illustration of how we selected a box from which to generate a lognormal density field from a larger-scale, low resolution lognormal density field. We illustrate the underlying density grid by drawing faint black points with density proportional to the local density field. Cyan points indicate our selection of the top 20 density maxima from the density field. The red star indicates the position of the adopted box centre. The dashed red lines indicate the boundary of the new zoom-in box.
Current usage metrics show cumulative count of Article Views (full-text article views including HTML views, PDF and ePub downloads, according to the available data) and Abstracts Views on Vision4Press platform.
Data correspond to usage on the plateform after 2015. The current usage metrics is available 48-96 hours after online publication and is updated daily on week days.
Initial download of the metrics may take a while.