Fig. 12
Download original image
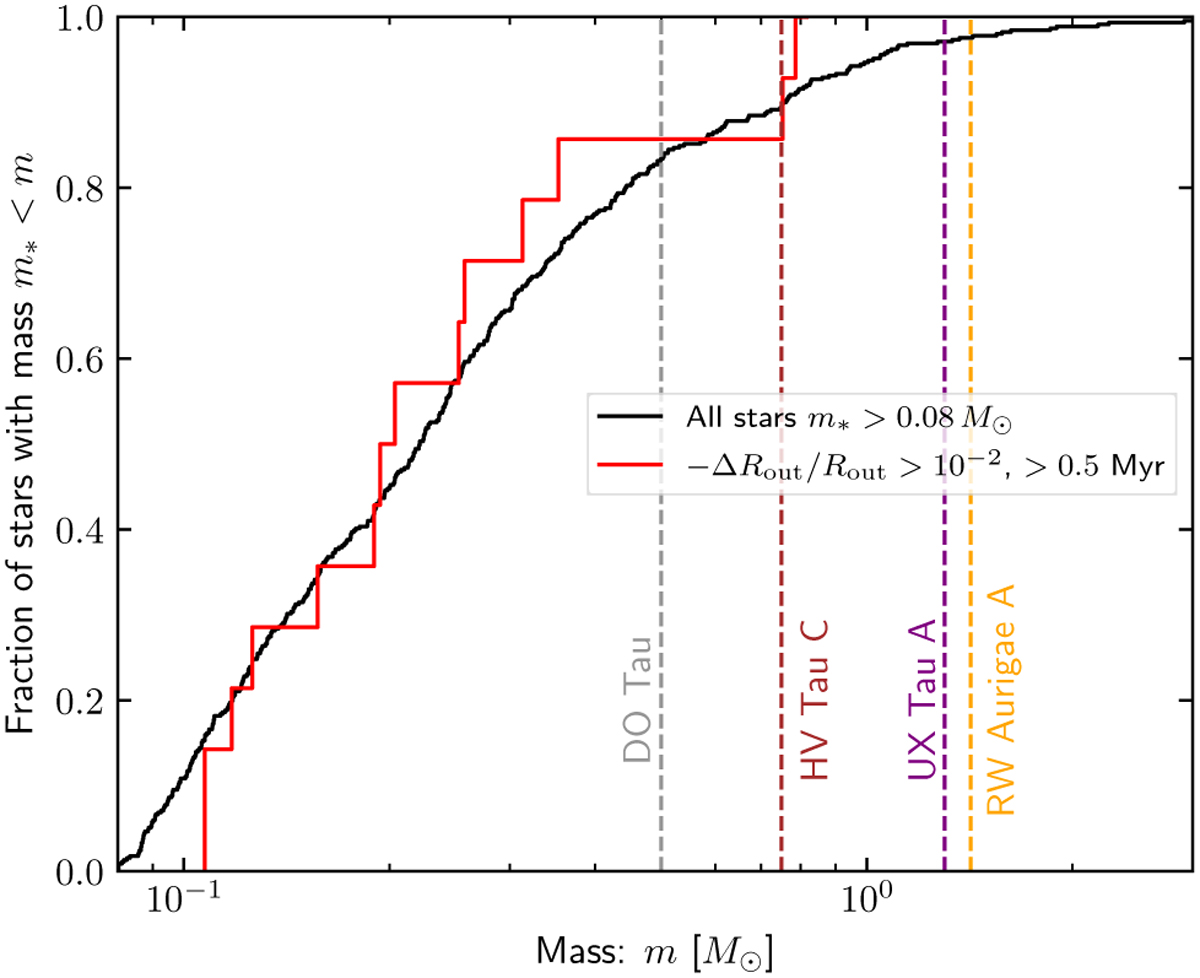
Cumulative distribution function for the masses m* of stars with m* > 0.08 M⊙ in our simulation (black line), compared with those that underwent a truncating encounter −∆Rout/Rout > 0.01 (red line). The distributions are not significantly different, with KS test probability pKS = 0.87. We also show mass estimates for the stars with discs that are responsible for the observed external structure. We do not show uncertainties in these estimates for clarity, but errors quoted are typically approximately ±0.3 M⊙. The distribution of masses of stars that have been inferred to have experienced recent truncating encounters are significantly different from those in our simulation, with pKS = 0.023.
Current usage metrics show cumulative count of Article Views (full-text article views including HTML views, PDF and ePub downloads, according to the available data) and Abstracts Views on Vision4Press platform.
Data correspond to usage on the plateform after 2015. The current usage metrics is available 48-96 hours after online publication and is updated daily on week days.
Initial download of the metrics may take a while.