Fig. 11
Download original image
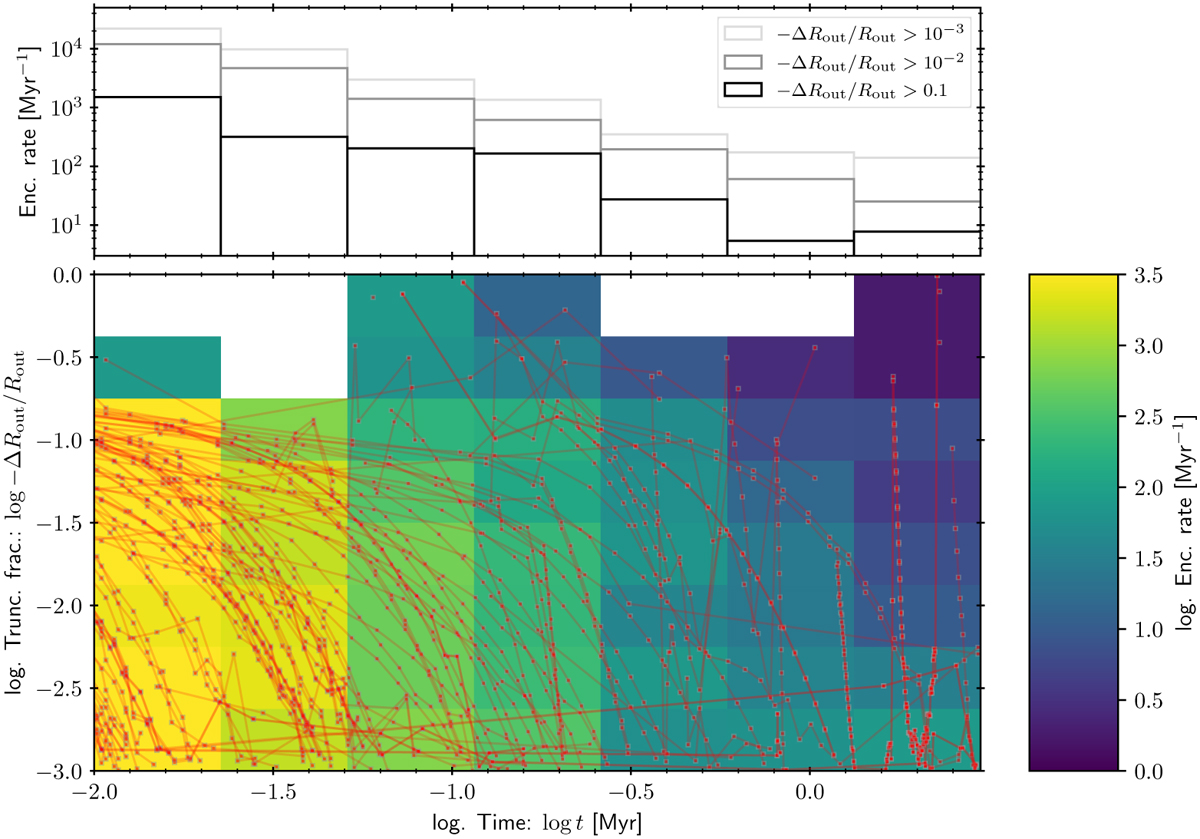
Global rate of disc-truncating encounters for discs around stars with mass m* > 0.08 M⊙ throughout the evolution of our dynamical model. The top panel shows the rate of all truncating encounters that decrease the disc radius by at least 0.1 percent (light grey), 1 percent (grey) and 10 percent (black) of the pre-encounter radius. The colour scale of the bottom panel shows the encounter rates binned into both the time of the encounter (x-axis) and the degree of truncation (y-axis). Each logged encounter is shown by a pink square, and subsequent encounters for the same disc (if any) are connected by faint red lines.
Current usage metrics show cumulative count of Article Views (full-text article views including HTML views, PDF and ePub downloads, according to the available data) and Abstracts Views on Vision4Press platform.
Data correspond to usage on the plateform after 2015. The current usage metrics is available 48-96 hours after online publication and is updated daily on week days.
Initial download of the metrics may take a while.