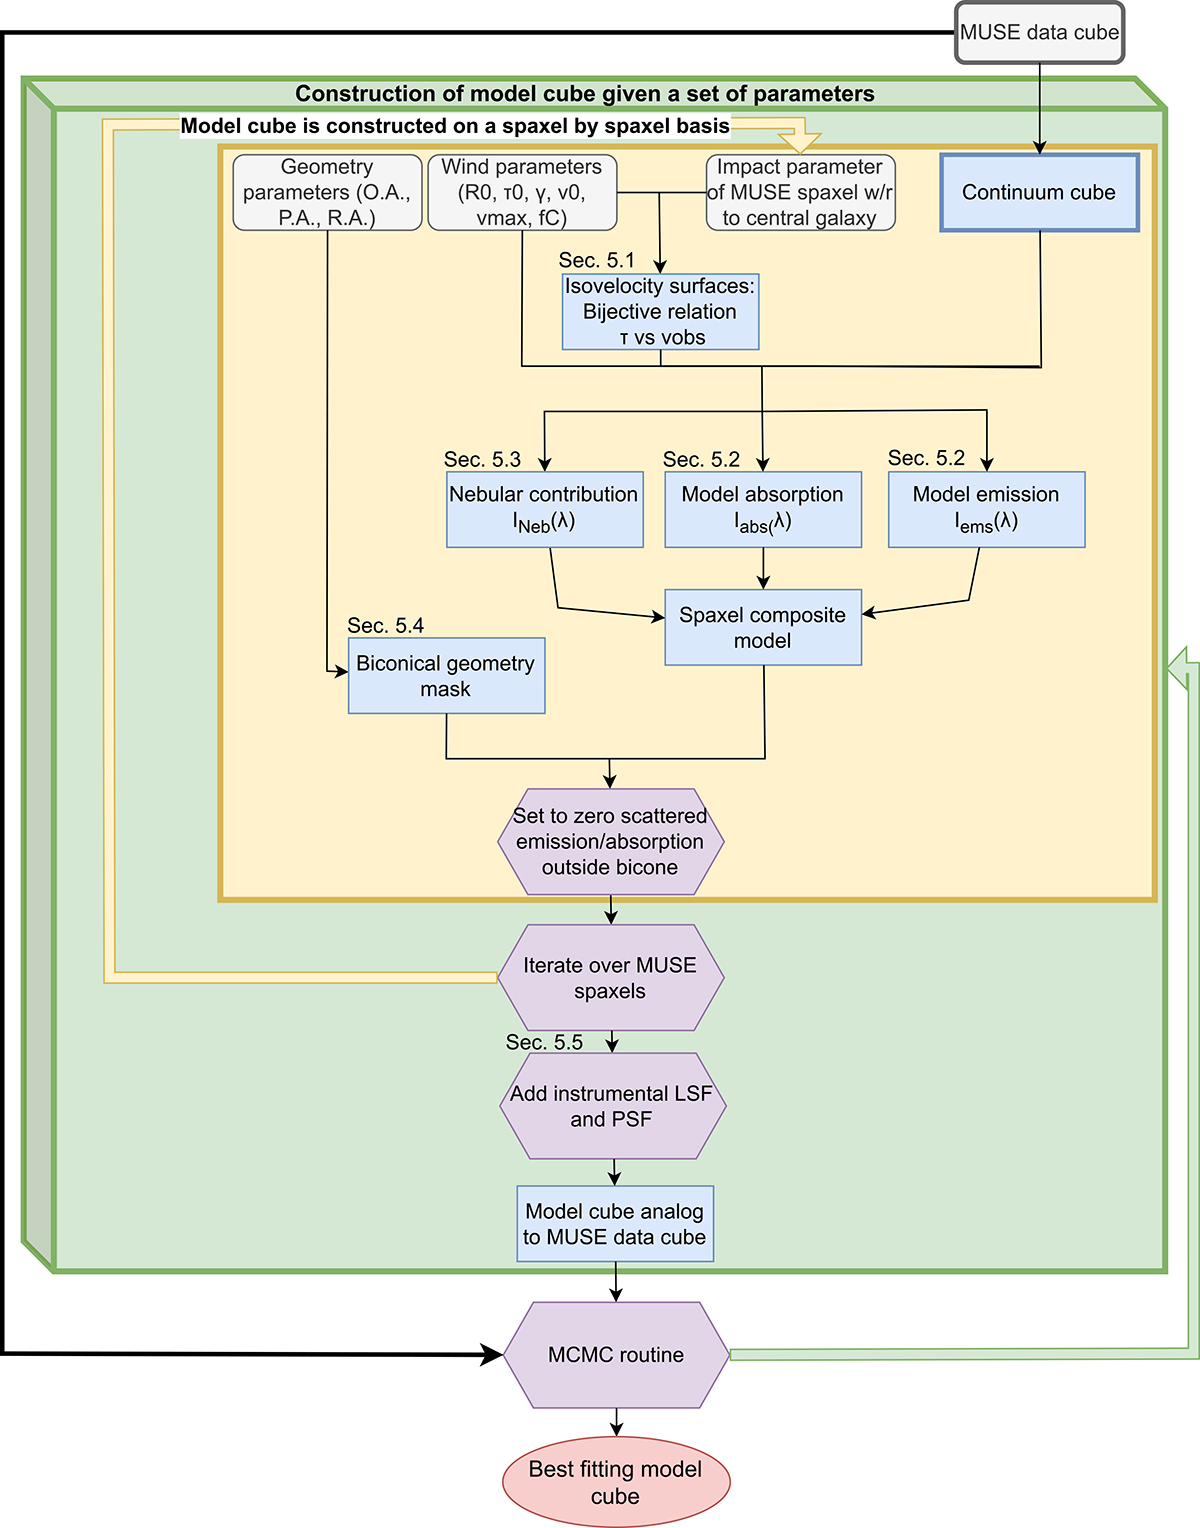
Fig. 5.
Download original image
Flow chart summarizing our modeling and fitting scheme. Gray rounded boxes correspond to inputs for the model, blue rectangles correspond to intermediate outputs, and purple hexagons correspond to processes. The final output is indicated with a red ellipse. For a given set of parameters, a model cube is constructed on a spaxel-by-spaxel basis. The iteration over different individual spaxels is indicated with the yellow area. We used an MCMC routine to find the best-fitting parameters that match our data cube. The complete MCMC iteration over the parameter space is enclosed within the green (including the yellow) area. The inputs and intermediate outputs surrounded by a thick box are static, that is, they do not change over any of the iterations performed. In the top-left part of some boxes, we indicate the section where the concept inside the box is described. See Sects. 5 and 6 for a comprehensive description of our modeling and fitting approach.
Current usage metrics show cumulative count of Article Views (full-text article views including HTML views, PDF and ePub downloads, according to the available data) and Abstracts Views on Vision4Press platform.
Data correspond to usage on the plateform after 2015. The current usage metrics is available 48-96 hours after online publication and is updated daily on week days.
Initial download of the metrics may take a while.