Fig. 3.
Download original image
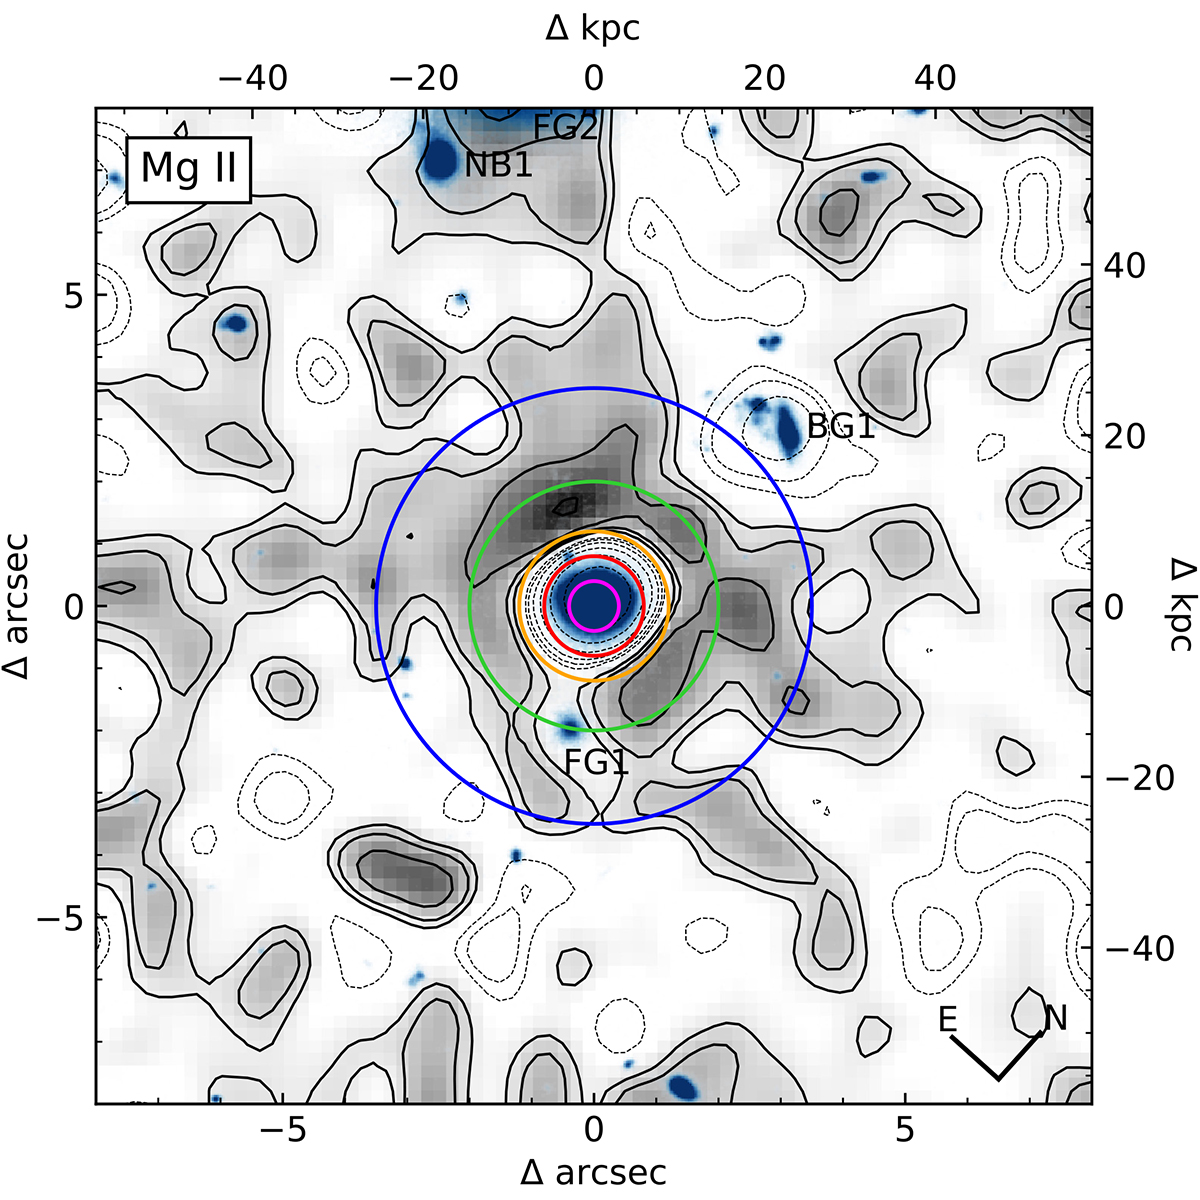
Pseudo-narrowband Mg II image extracted from the MUSE data cube by summing over the spectral range of the doublet and filtering with a Gaussian of 1″ FWHM. Underlying in blue scale is the HST F775W image, with other galaxies labeled as in Fig. 1. The black solid contours are spaced logarithmically at 0.25 dex interval, starting at log10(s) of −18.5, where s is surface brightness in erg s−1 cm−2 arcsec−2. The lowest contour corresponds to a S/N of ∼1.5 in the filtered image. The dotted contours indicate negative measured values of s. The central hole in the Mg II surface brightness distribution is a result of the continuum subtraction, since #884 is a net absorber in its central spectrum. Similarly, the apparently negative region at the background galaxy BG1 is caused by the strong Mg II absorption in the continuum of BG1. The colored circumferences indicate the radii of the annular apertures used to extract radially resolved spectra in Sect. 4.2.
Current usage metrics show cumulative count of Article Views (full-text article views including HTML views, PDF and ePub downloads, according to the available data) and Abstracts Views on Vision4Press platform.
Data correspond to usage on the plateform after 2015. The current usage metrics is available 48-96 hours after online publication and is updated daily on week days.
Initial download of the metrics may take a while.