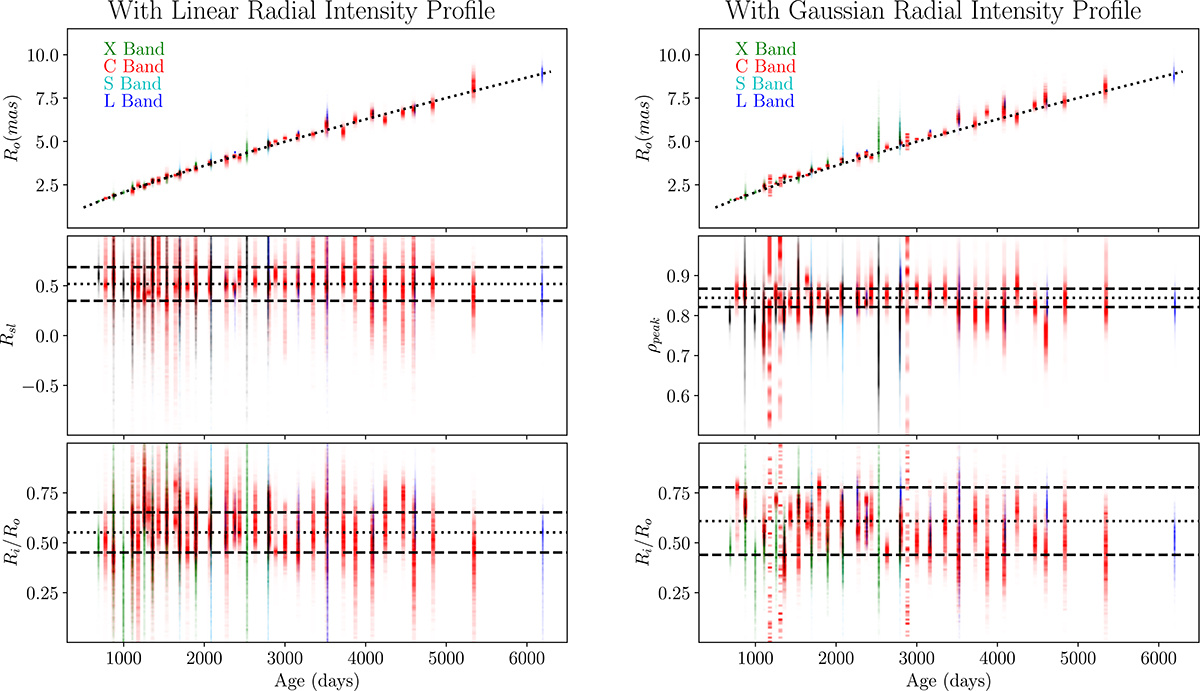
Fig. 9.
Download original image
Posterior shell parameter distributions for the model with a linear (left) and Gaussian (right) radial intensity profile. Top panels, shell size; center panels, radial intensity parameters (slope, Rsl, at left; peak position, ρpeak, at right); bottom panels, Ri/Ro. The color codes are the same as in the previous figures. Dotted lines in the top panels show the power law expansion model Ro ∝ tm (with m = 0.8). Dotted (dashed) lines in the center and bottom panels mark the average (±1σ) values for the whole campaign.
Current usage metrics show cumulative count of Article Views (full-text article views including HTML views, PDF and ePub downloads, according to the available data) and Abstracts Views on Vision4Press platform.
Data correspond to usage on the plateform after 2015. The current usage metrics is available 48-96 hours after online publication and is updated daily on week days.
Initial download of the metrics may take a while.