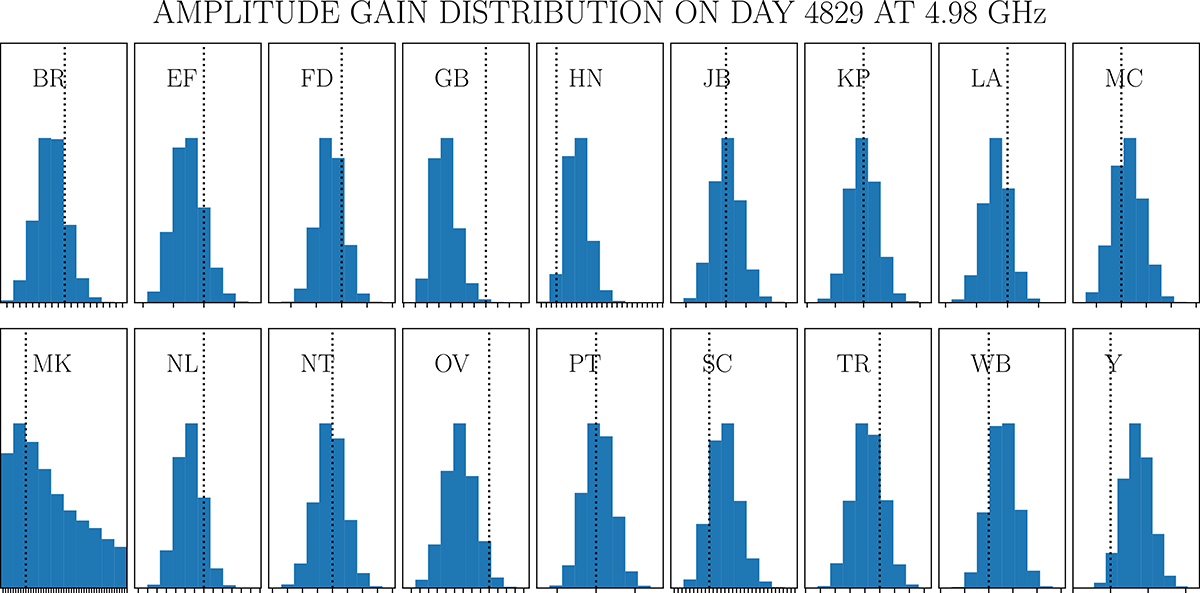
Fig. 3.
Download original image
Posterior distributions of the antenna amplitude gain factors for the 5 GHz epoch on day 4829. These are incremental corrections, after applying the Tsys, gain-elevation curves and global amplitude scaling (based on self-calibration of M 81*) to the data. Tick marks are separated by intervals of 0.1. Dotted lines mark the value of a unity gain factor. The histogram for MK has been cut for gains < 5, for clarity.
Current usage metrics show cumulative count of Article Views (full-text article views including HTML views, PDF and ePub downloads, according to the available data) and Abstracts Views on Vision4Press platform.
Data correspond to usage on the plateform after 2015. The current usage metrics is available 48-96 hours after online publication and is updated daily on week days.
Initial download of the metrics may take a while.