Fig. 3.
Download original image
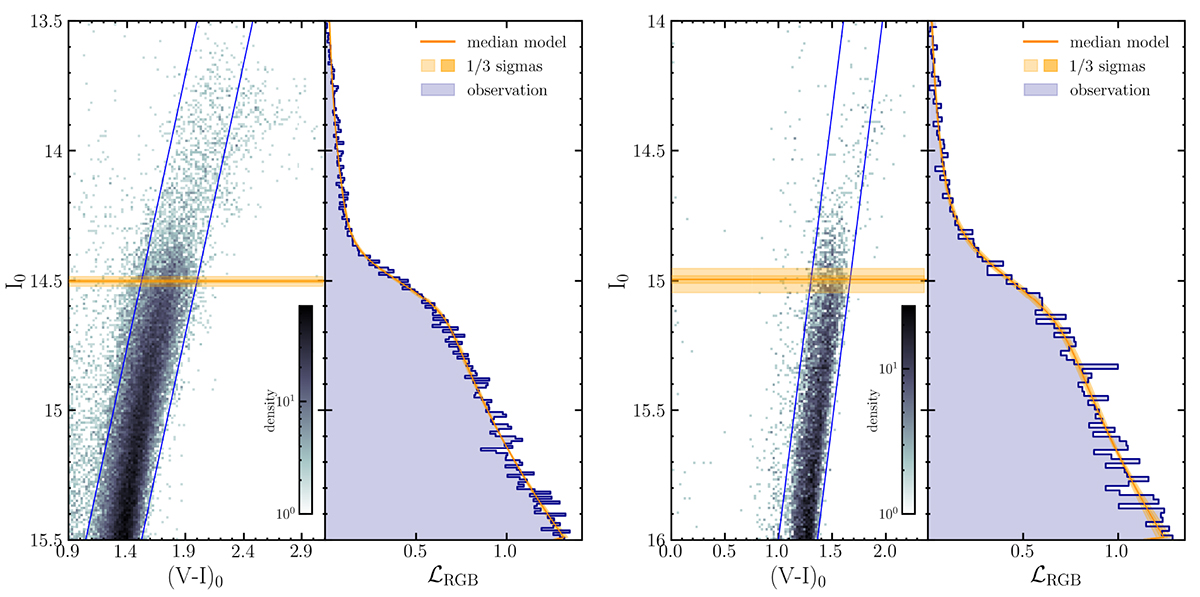
Measuring the RGB tip in JKC I band in the LMC (left pair of panels) and in the SMC (right pair of panels). The left panels of each pair display the CMD of the considered sample with the selection of the RGB + AGB sub-sample that is later used to construct the LF (stars enclosed within the blue parallel lines). The orange horizontal line marks the position of the RGB tip and the shaded bands show the 1σ and 3σ confidence intervals. The right panels of each pair show the LF of the selected RGB + AGB sub-sample (light-blue histogram) and the best-fit model which we used to estimate ITRGB.
Current usage metrics show cumulative count of Article Views (full-text article views including HTML views, PDF and ePub downloads, according to the available data) and Abstracts Views on Vision4Press platform.
Data correspond to usage on the plateform after 2015. The current usage metrics is available 48-96 hours after online publication and is updated daily on week days.
Initial download of the metrics may take a while.