Fig. 1
Download original image
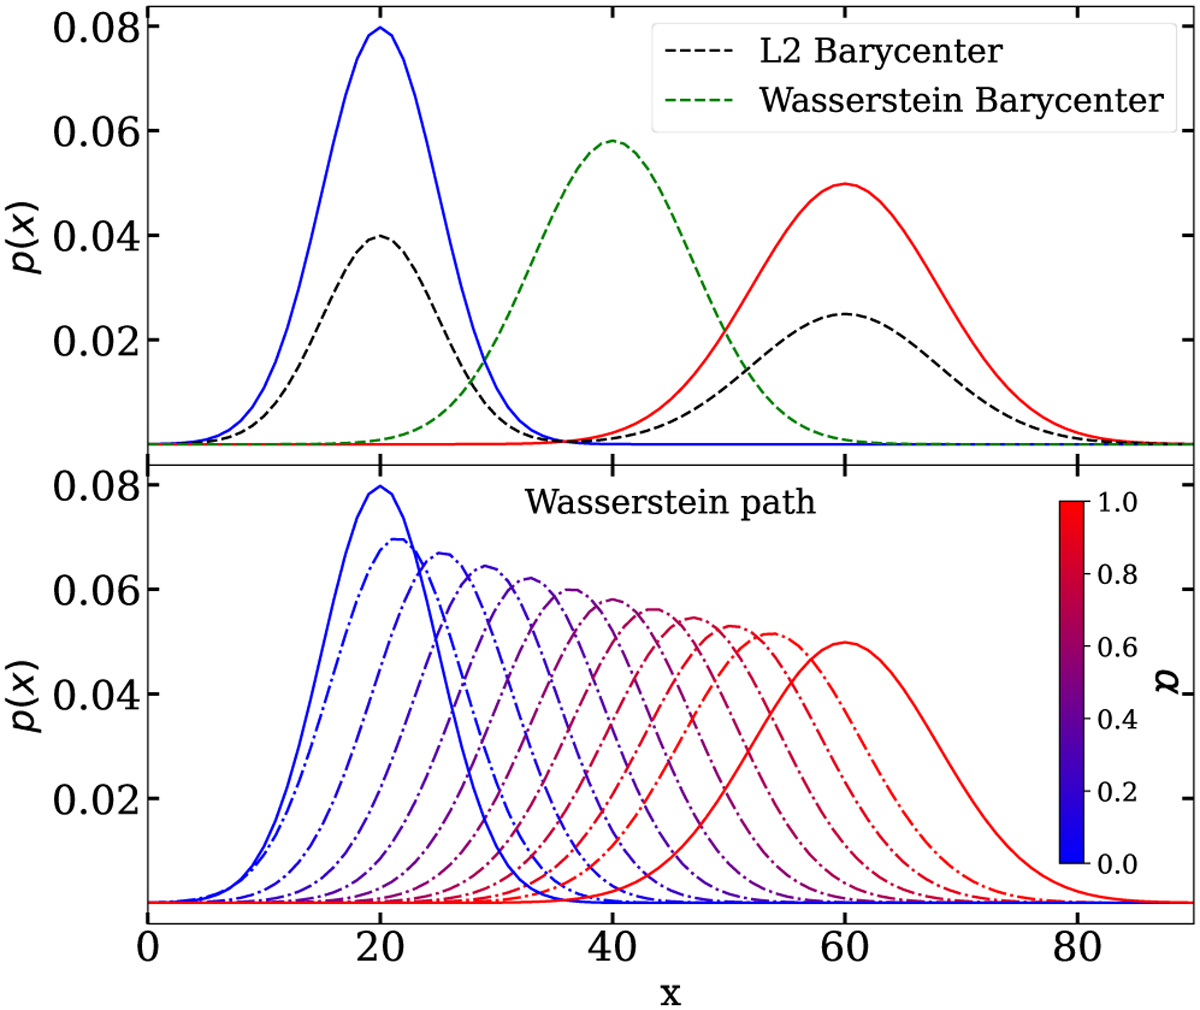
Comparison between the L2 barycenter and the Wasserstein barycenter. The starting and final distributions are in blue and red, respectively. The black dashed distribution represents the barycenter calculated using the L2 distance, whereas the green dashed distribution is computed using the Wasserstein distance. The bottom panel illustrates the interpolation path of the Wasserstein barycenter for different a values, highlighting its transition from the starting distribution to the final one.
Current usage metrics show cumulative count of Article Views (full-text article views including HTML views, PDF and ePub downloads, according to the available data) and Abstracts Views on Vision4Press platform.
Data correspond to usage on the plateform after 2015. The current usage metrics is available 48-96 hours after online publication and is updated daily on week days.
Initial download of the metrics may take a while.