Fig. 5

Download original image
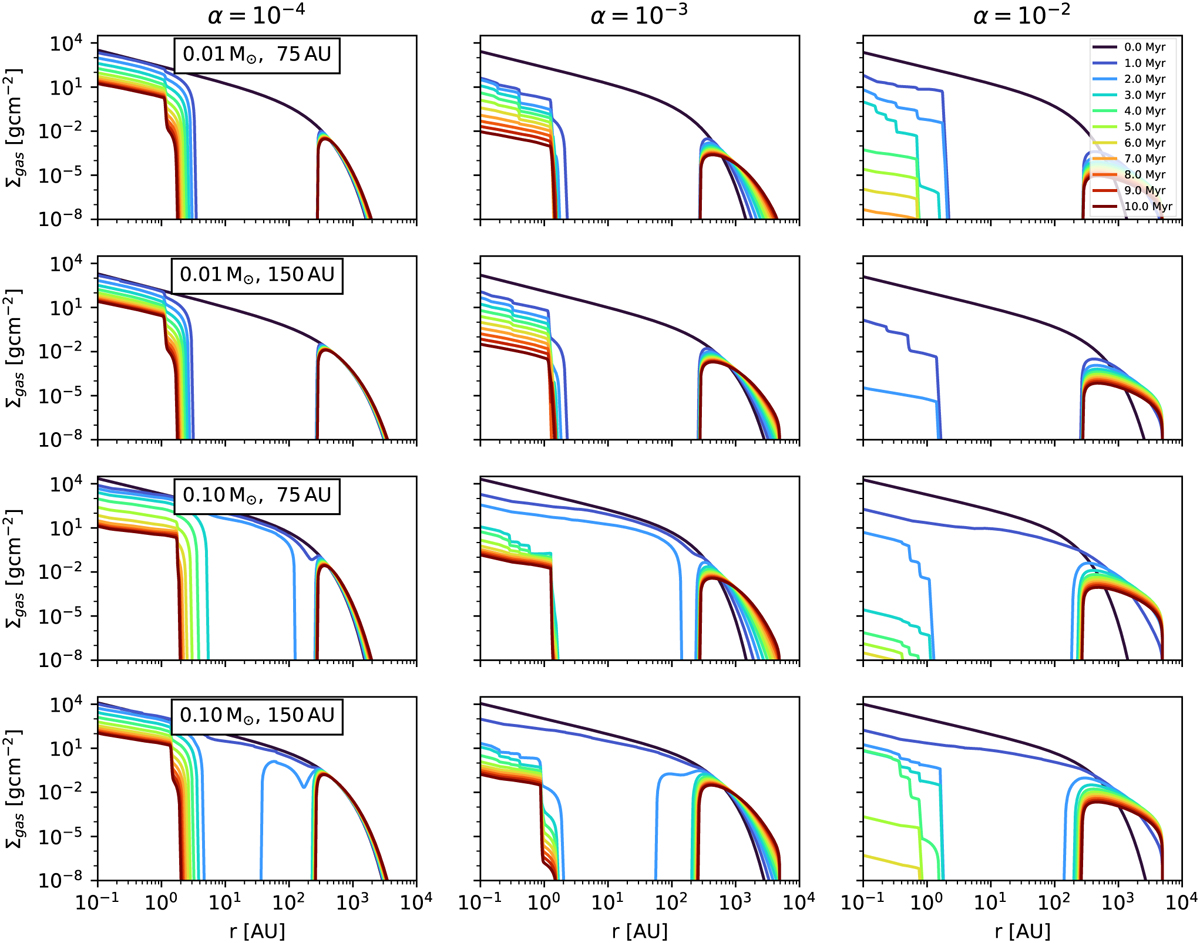
Gas surface density for a viscous disc with internal photoevaporation due to X-rays. The gas surface density is shown as a function of disc radius and time. A variety of parameter configurations is used for this study: along the x-axis of this figure, α is varied from α = 10−4 to α = 10−2, whereas on the y-axis, different sets of disc masses and radii are used, varying in the range of Mdisc = 0.01–0.1 M⊙ and Rdisc = 75–150 AU. Colour coding, plotting and stellar mass as in Figure 2.
Current usage metrics show cumulative count of Article Views (full-text article views including HTML views, PDF and ePub downloads, according to the available data) and Abstracts Views on Vision4Press platform.
Data correspond to usage on the plateform after 2015. The current usage metrics is available 48-96 hours after online publication and is updated daily on week days.
Initial download of the metrics may take a while.


