Open Access
Fig. 3
Download original image
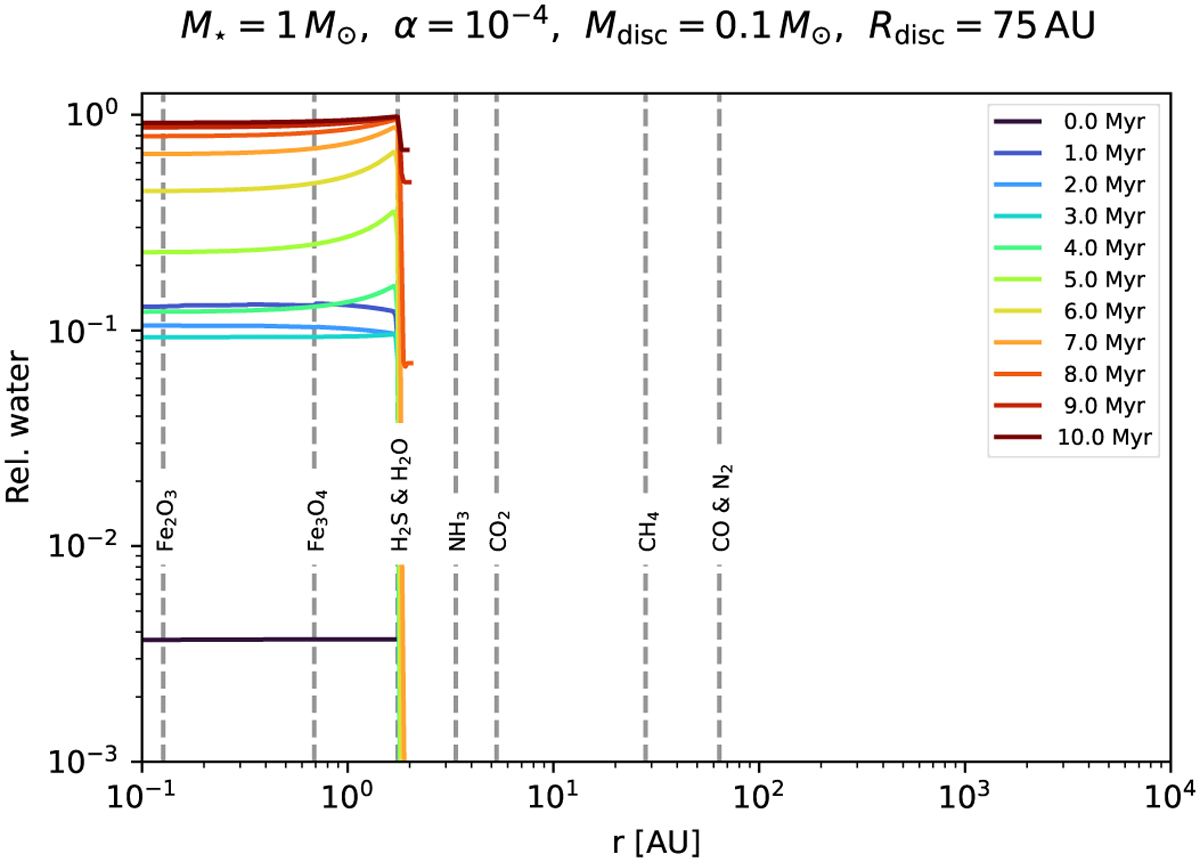
Relative water content as a function of disc radius and time. Internal photoevaporation is active in this simulation. Note that the relative water content is calculated as a ratio of gas surface densities, and is therefore shown as a mass fraction here. Colour coding, plotting and simulation parameters as in Figure 2.
Current usage metrics show cumulative count of Article Views (full-text article views including HTML views, PDF and ePub downloads, according to the available data) and Abstracts Views on Vision4Press platform.
Data correspond to usage on the plateform after 2015. The current usage metrics is available 48-96 hours after online publication and is updated daily on week days.
Initial download of the metrics may take a while.