Fig. 6
Download original image
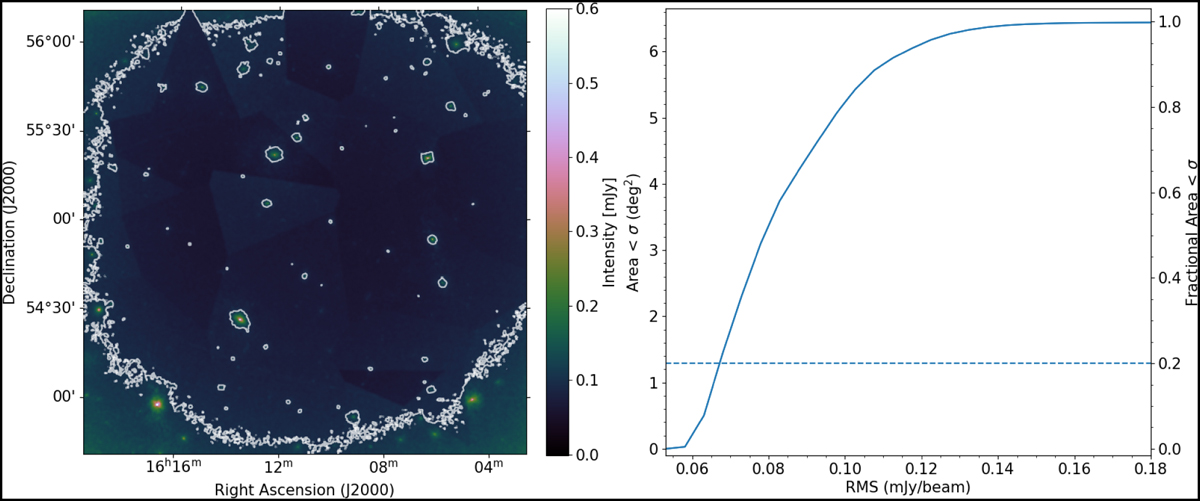
Left panel shows the RMS noise image of the ELAIS-N1 field, with a contour level at 0.1 mJy beam−1 overlaid. The contours at the positions of bright sources indicate that their direction-dependent effects (DDEs) are not completely eliminated. The right panel depicts the cumulative ratio of pixels in the RMS image against RMS noise values. The x-axis represents the RMS noise value, while the y-axis shows the percentage of image pixels with RMS values greater than or equal to a given RMS noise value, along with its corresponding physical area.
Current usage metrics show cumulative count of Article Views (full-text article views including HTML views, PDF and ePub downloads, according to the available data) and Abstracts Views on Vision4Press platform.
Data correspond to usage on the plateform after 2015. The current usage metrics is available 48-96 hours after online publication and is updated daily on week days.
Initial download of the metrics may take a while.