Fig. 5

Download original image
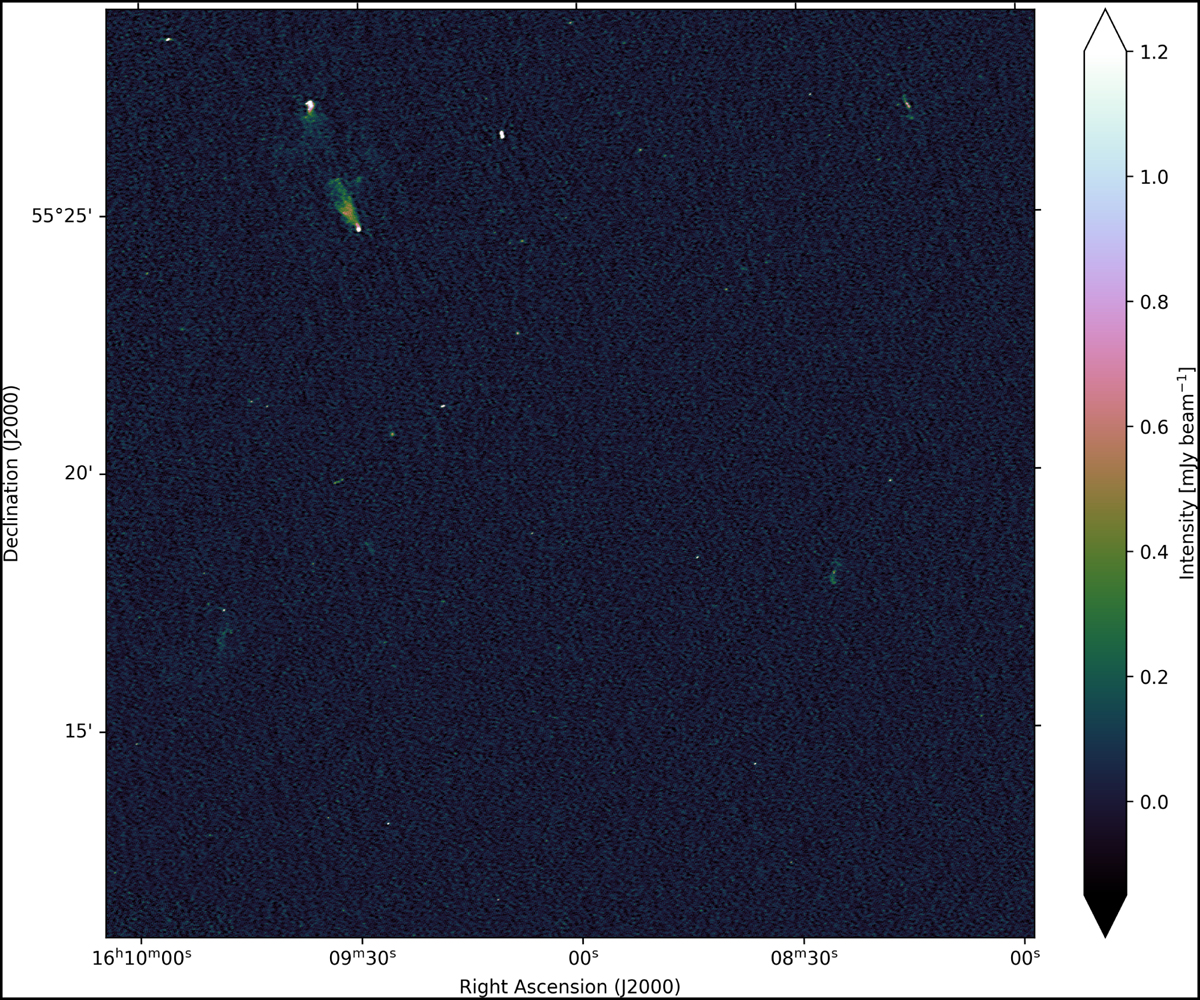
Zoom-in image of the central region in the ELAIS-N1 field, created from an 8-hour observation using the international LOFAR telescope at a frequency range of 120-168 MHz. This region is centred at (16h09m01.36s, 55m19m56.7s) and is 0.3 deg × 0.3 deg in size, with a resolution of 1.2″ × 2″. The colour bar represents the flux density from −2σ to 20σ, where σ = 0.122 mJy beam−1 is the approximate RMS noise in this region of the image.
Current usage metrics show cumulative count of Article Views (full-text article views including HTML views, PDF and ePub downloads, according to the available data) and Abstracts Views on Vision4Press platform.
Data correspond to usage on the plateform after 2015. The current usage metrics is available 48-96 hours after online publication and is updated daily on week days.
Initial download of the metrics may take a while.


