Fig. B.4
Download original image
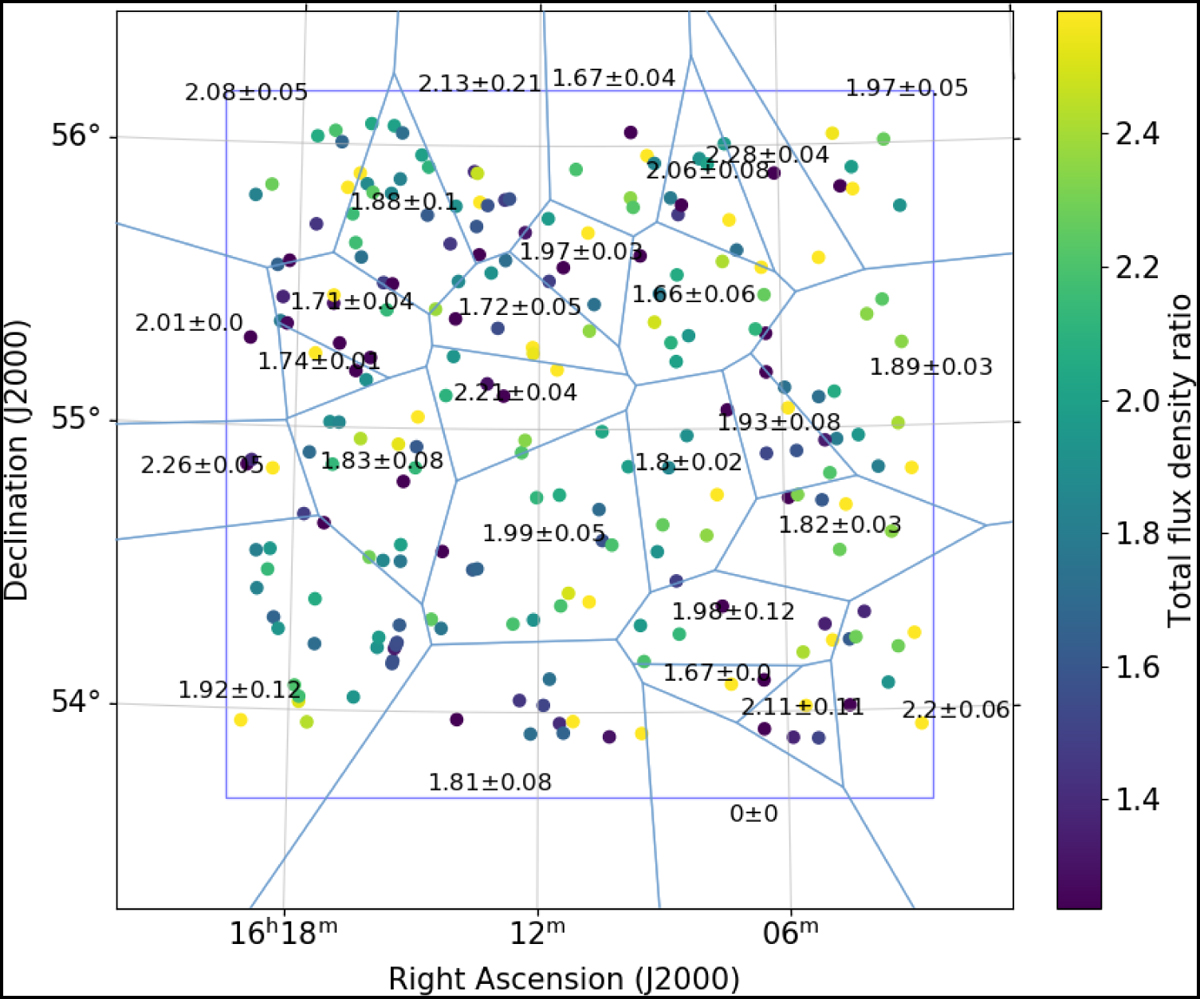
Sources selected to determine the flux density scaling factor in Section 4.2.2 are plotted as coloured dots on the image plane, with each imaging facet marked by blue polygons. The average values of the flux density ratios for all the sources within a given facet is displayed inside the facet along with the standard deviations.
Current usage metrics show cumulative count of Article Views (full-text article views including HTML views, PDF and ePub downloads, according to the available data) and Abstracts Views on Vision4Press platform.
Data correspond to usage on the plateform after 2015. The current usage metrics is available 48-96 hours after online publication and is updated daily on week days.
Initial download of the metrics may take a while.