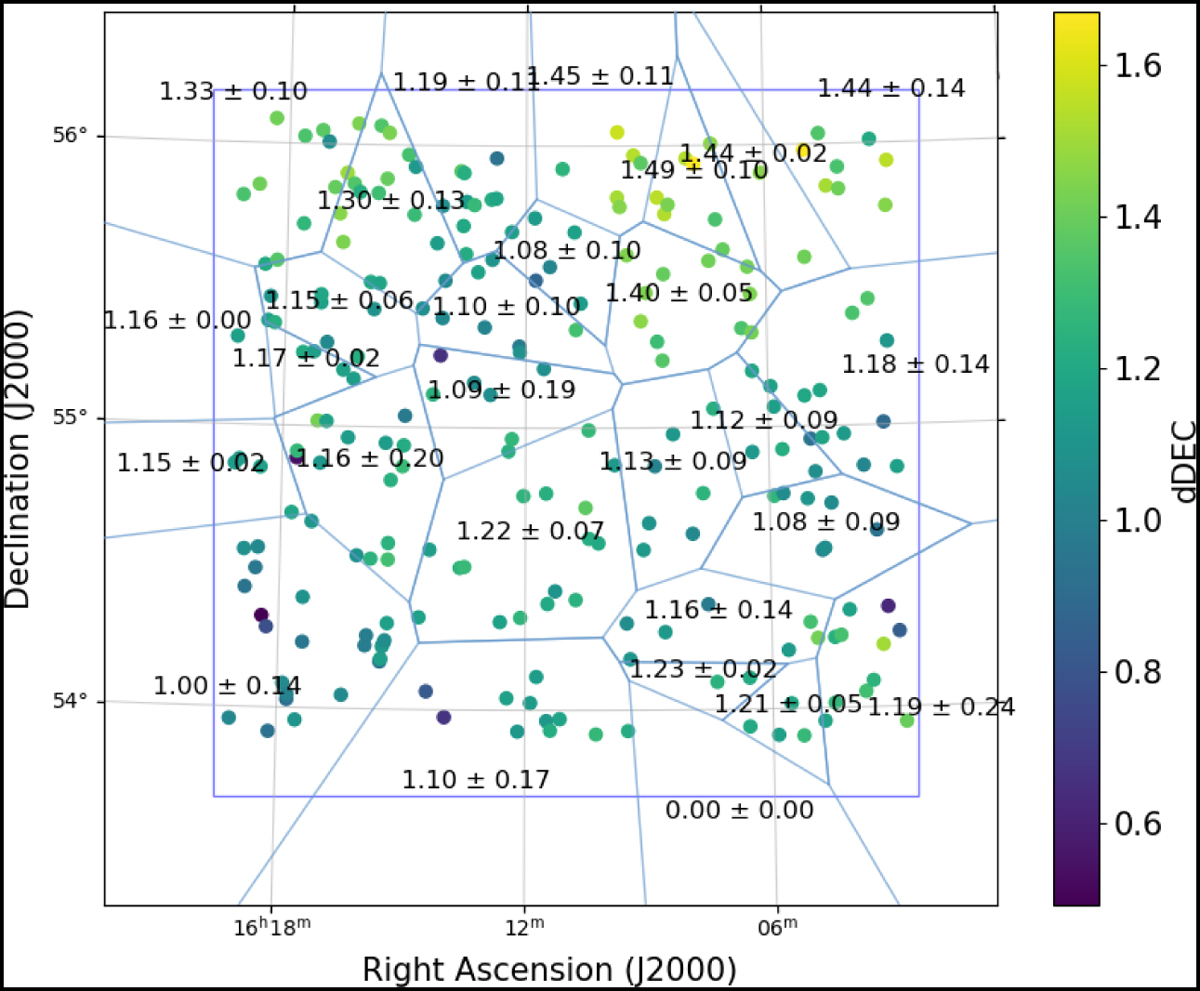
Fig. B.2
Download original image
Sources selected for astrometric correction, totalling 231, are plotted as coloured dots on the image plane, with each imaging facet marked by blue polygons. The average of the dDEC values and their standard deviations are marked within each facet. If we subtract the astrometric offset derived for DEC in this work (1.9134) from the mean values of each facet, the mean values of each facet are well below 1.2′′, the resolution of our image.
Current usage metrics show cumulative count of Article Views (full-text article views including HTML views, PDF and ePub downloads, according to the available data) and Abstracts Views on Vision4Press platform.
Data correspond to usage on the plateform after 2015. The current usage metrics is available 48-96 hours after online publication and is updated daily on week days.
Initial download of the metrics may take a while.