Fig. 12
Download original image
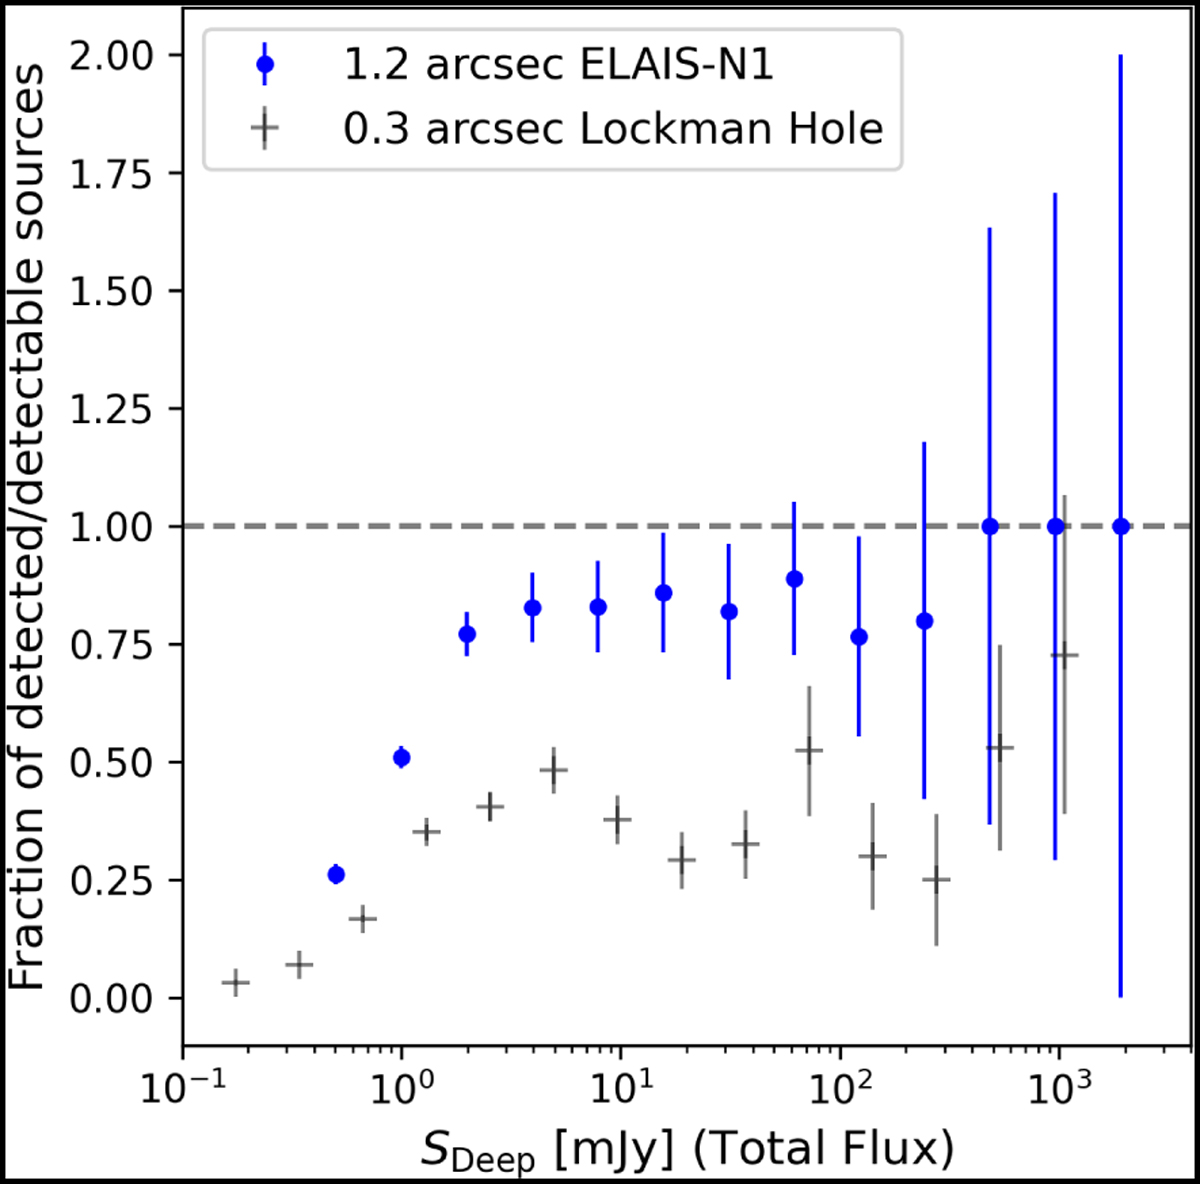
Plot shows the ratio of detected to detectable sources in the 1.2″ resolution image as a function of flux density, based on the 6″ resolution LoTSS deep field catalogue. Sources from the 6″ resolution LOFAR deep field ELAIS-N1 catalogue are considered detectable if their peak intensity exceeds 5.5 times the RMS at the same coordinates in our 1.2″ resolution ELAIS-N1 image. The blue dots demonstrate this ratio. Uncertainties are estimated using the ![]() method and propagated accordingly.
method and propagated accordingly.
Current usage metrics show cumulative count of Article Views (full-text article views including HTML views, PDF and ePub downloads, according to the available data) and Abstracts Views on Vision4Press platform.
Data correspond to usage on the plateform after 2015. The current usage metrics is available 48-96 hours after online publication and is updated daily on week days.
Initial download of the metrics may take a while.